Tracking Two Near-Term Bullish Counts
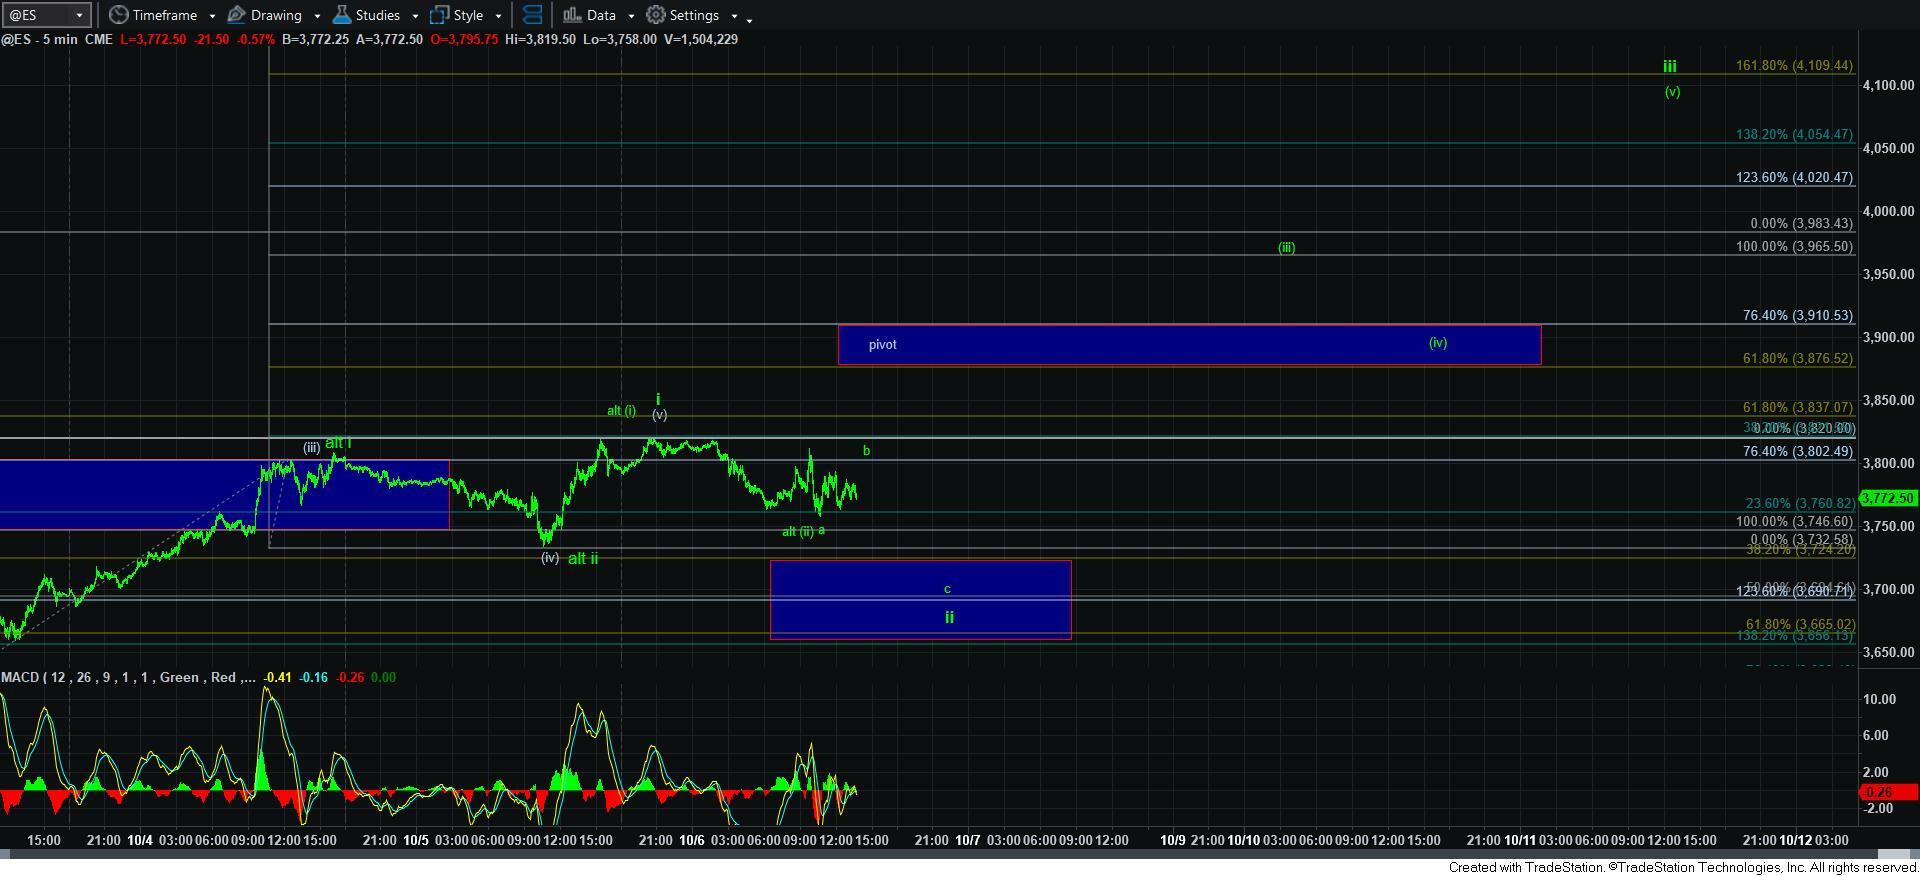
As we have seen these last few days, we seem to have completed a 5-wave rally off the recent lows. Due to the size of the extensions off the low, one can even consider a more accelerated bullish count as well, which suggests that we already have a i-ii, [i][ii] off the lows. And, when you look at the attached 5-minute ES chart, I have this labeled as an alternative count.
To keep this very simple, as long as we remain below today’s high, I am looking for more of a wave ii pullback in a more protracted a-b-c structure. However, if we break out over today’s high, and then follow through over yesterday’s high, then I have to adopt the more accelerated wave count, which suggests that wave [iii] of iii is targeting at least the 3965ES region.
Of course, if we get the deeper wave ii pullback, then I will re-set the Fibonacci Pinball targets overhead. And, our support for this wave ii is in the 3655-3725ES region.
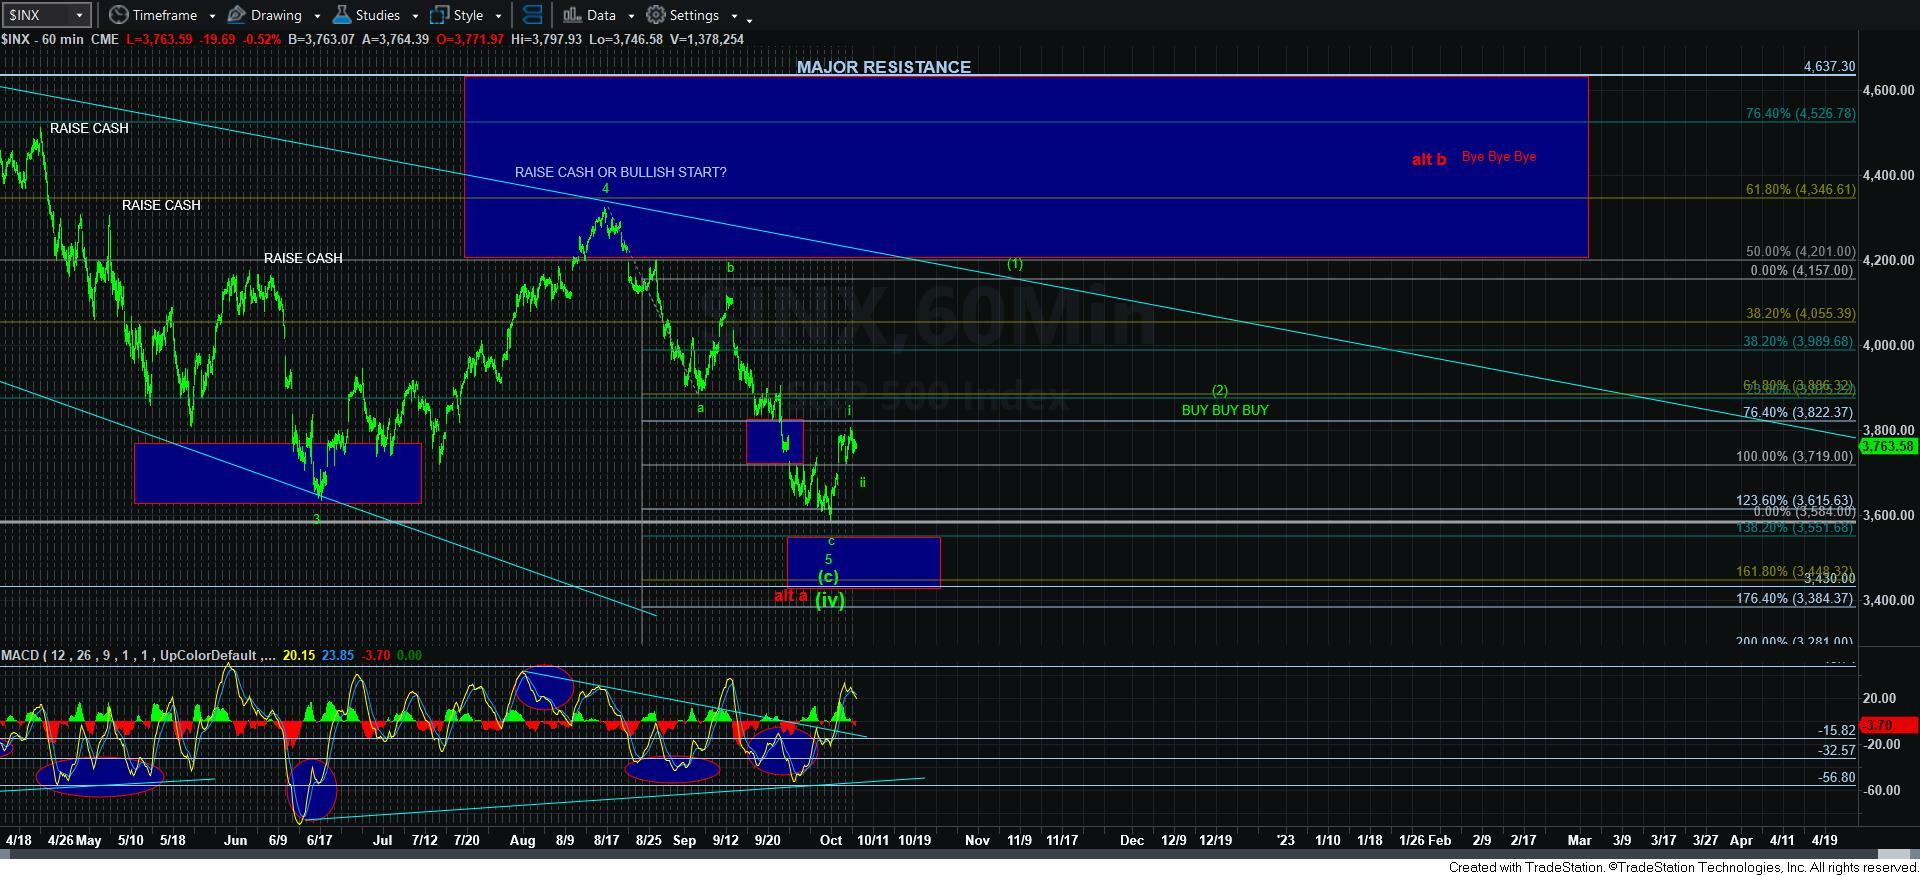
Also, this structure seems to be projecting us back to the 4150-4200SPX region in a full 5-wave structure. Should that occur, then the ensuing pullback will be of utmost importance in determining if we are indeed heading to a new all-time high, or if the market has indeed topped out in its long-term structure. For now, I still remain in the bullish camp until the market proves otherwise.