Tracking A “Topping”
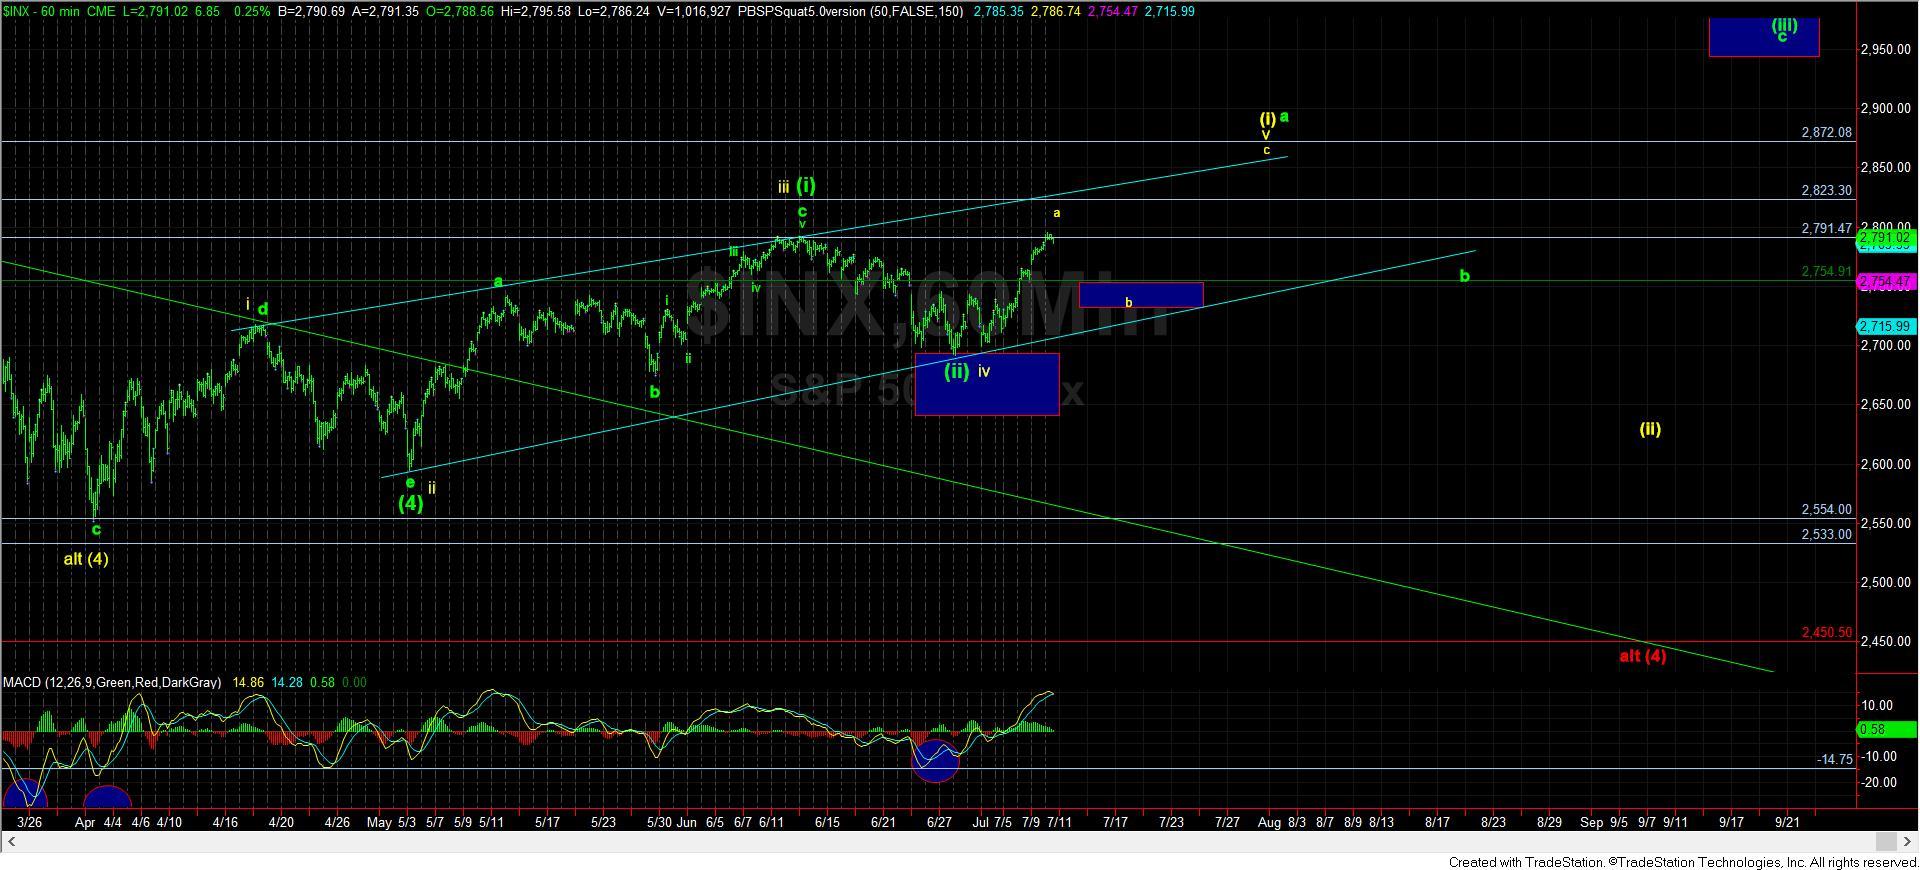
As the market approaches the 2800SPX region, our assumption was that we are likely setting up a topping of sorts. While my ideal scenario would push us a bit higher than we hit today, especially in the IWM, we have to be on our toes, as it is certainly possible that the market has struck the top of the a-wave in the SPX.
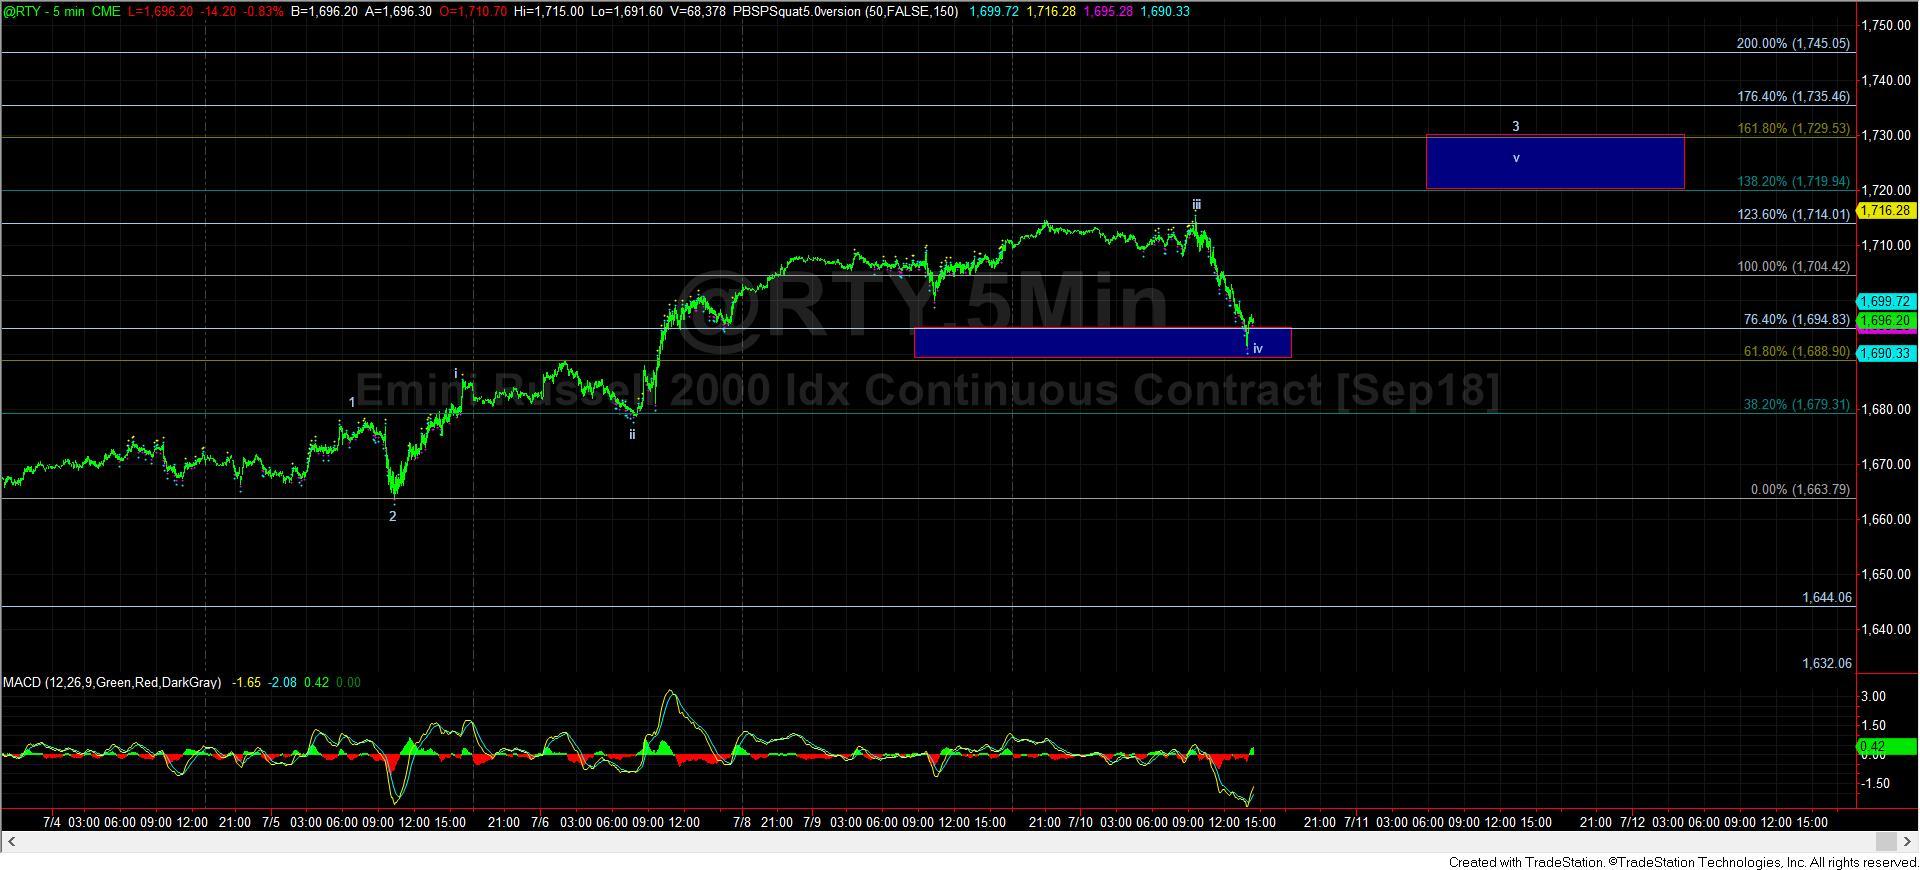
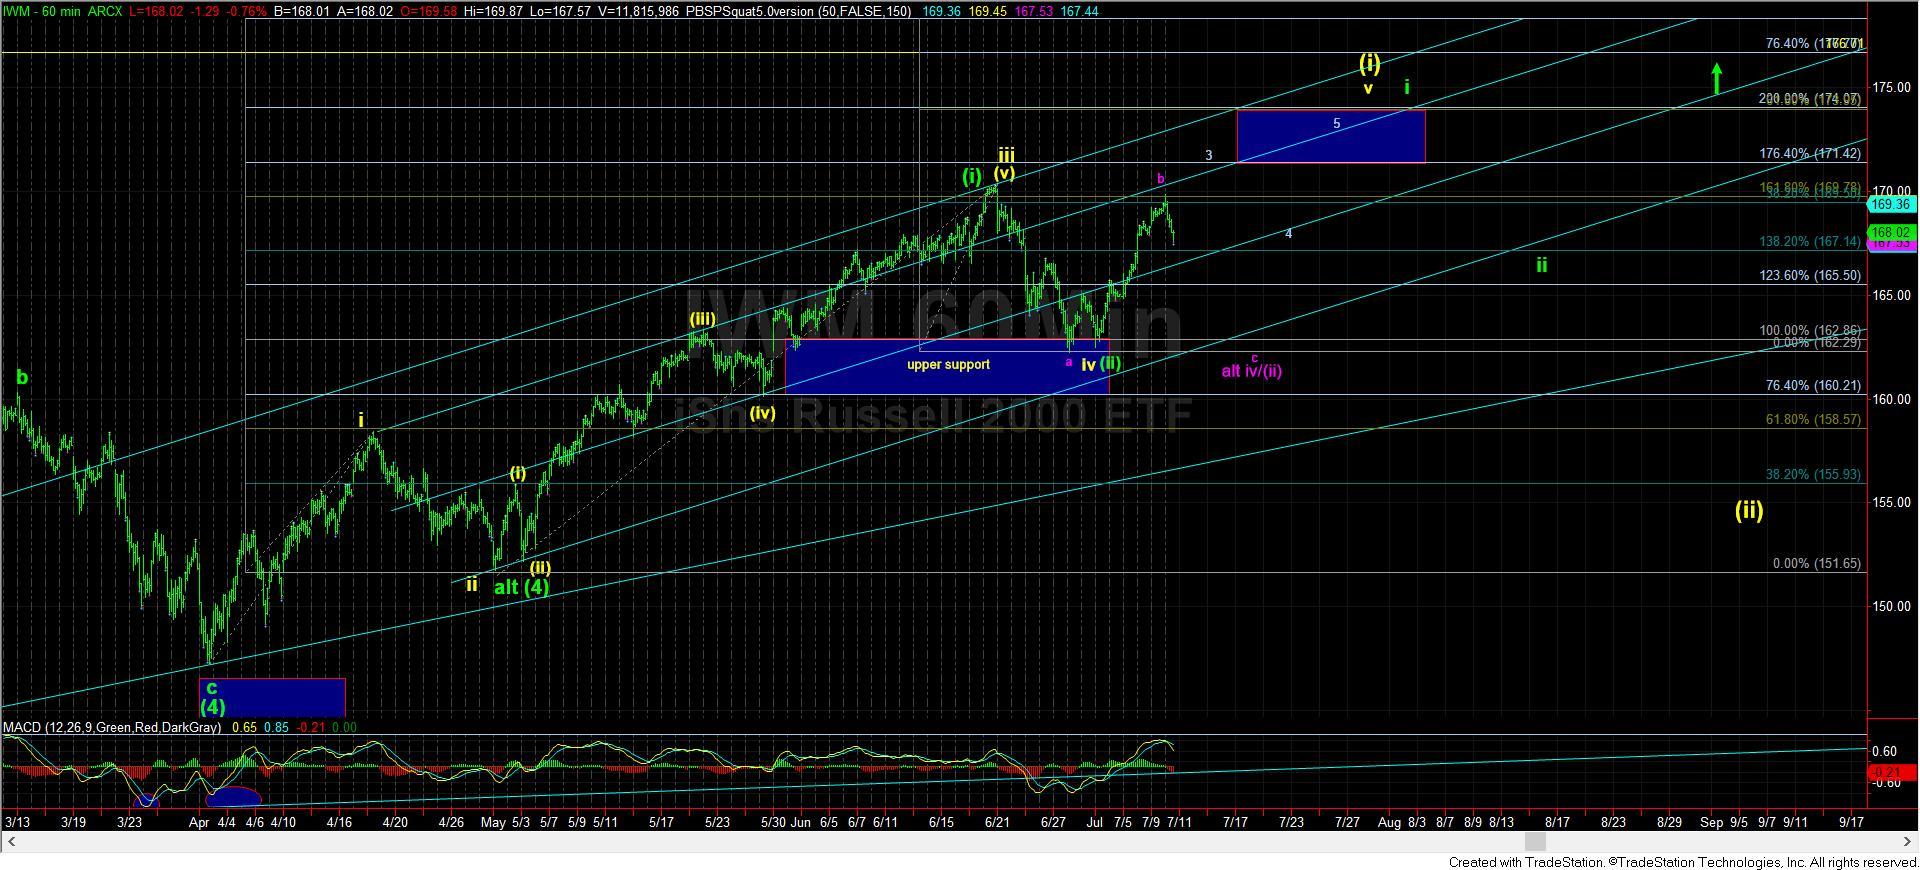
The problem that I have if the SPX has topped is that the IWM has not completed its ideal structure for the 3rd wave of its wave v. So, I have had to add an alternative perspective in the shorter term on the IWM. As you can see in the attached 5-minute RTY chart, as long as we hold the 1688 level in the RTY, we still have a path to complete wave v of 3 in the IWM/RTY. However, if we break below 1688, and follow through below 1685RTY, it opens the door to the bigger flat presented in purple on the 60-minute IWM chart.
So, while my preference still is to look for a bit higher before the a-wave in SPX and the wave 3 of v of (i) (or green i) completes in the IWM, we have to listen to the signals the market provides so we can adjust if it causes us to change our short-term plans.
But, the most important thing that occurred today was that the SPX has moved over its June high, which invalidates any immediate potential for the red count we have kept on the chart. While that pattern may resurrect at a top at 2823SPX – as we have discussed so often – this potential is still considered to be a much lower probability, which has even been reduced further by today’s action.
Ultimately, I still think we can head higher in July, but the only question is where do we get the b-wave pullback from in SPX. And, ideally, I would like to get one more rally before that begins. Yet, should the IWM break below noted support, it becomes much more likely that the SPX has begun its b-wave.