Topping Takes Patience - Market Analysis for Jul 19th, 2023
Yes, I know the market has gone past my ideal standard targets now. But, as I have asked before, does that mean I should jump back in with both feet?
I think we all know the answer to that question. The more the rubber band stretches in one direction, the harder and faster the snap back usually happens. So, as the market continues to stretch, it really does not change my analysis. It just suggests that the turn could potentially be faster and harder as everyone attempts for run the exits at the same time, especially when there has been a liquidity vacuum created below price with all the shorts pushed out of the market.
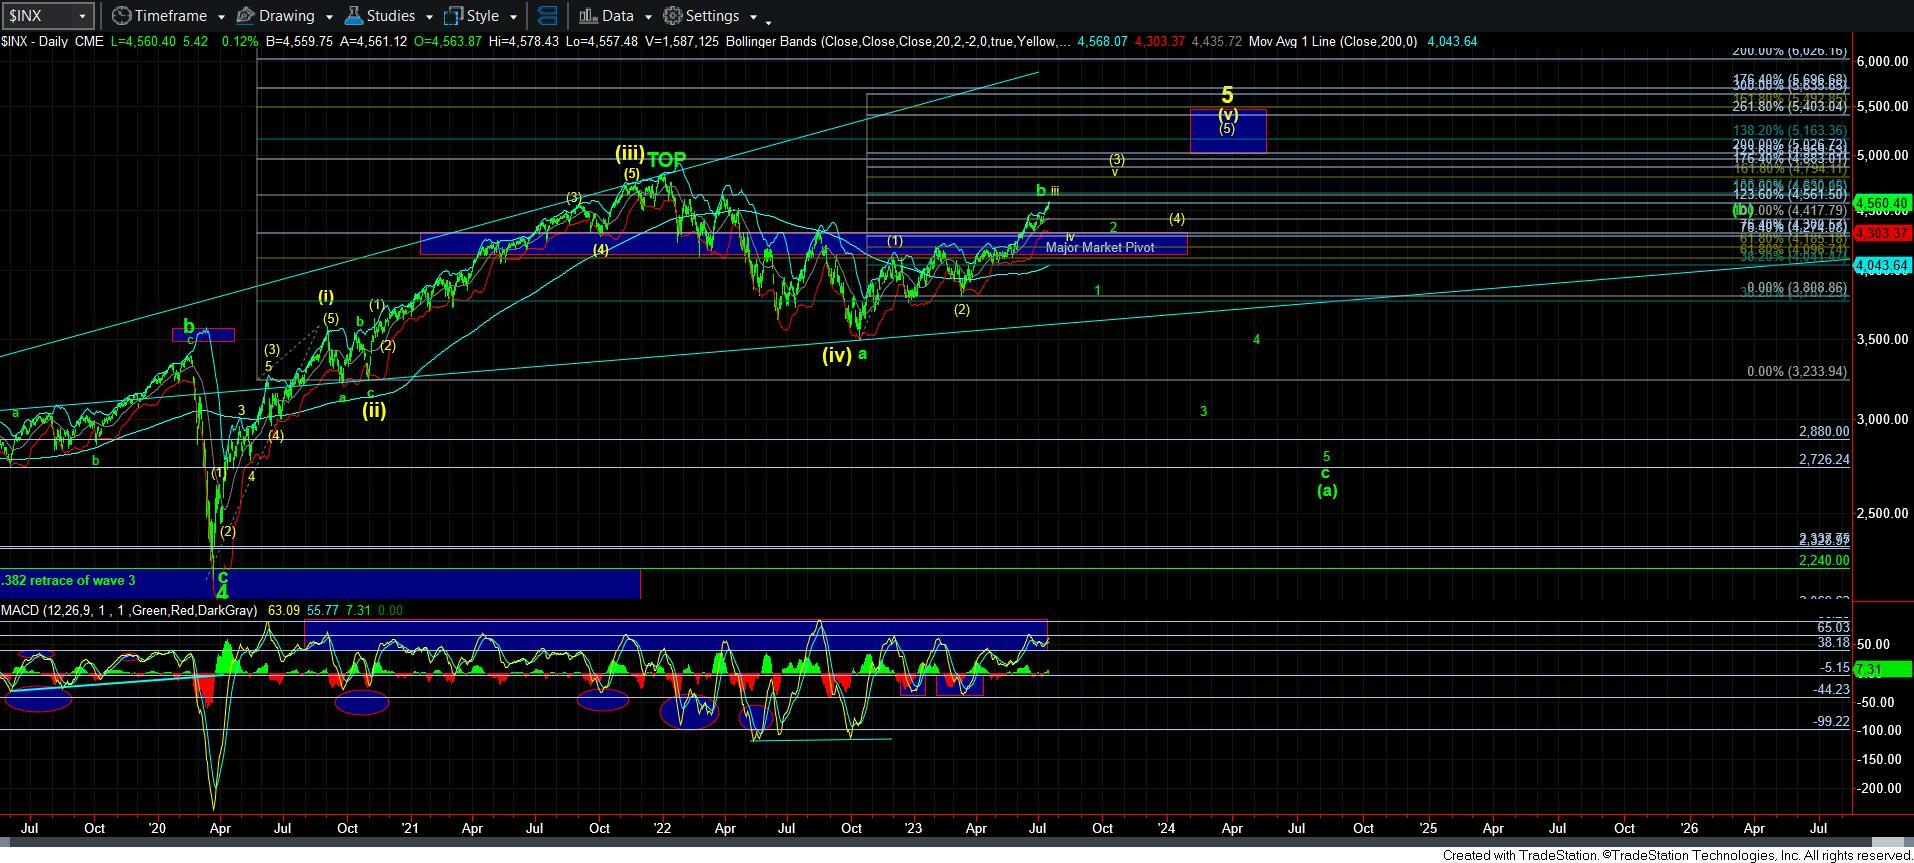
My primary count remains this being a b-wave rally. Now, for those that view that as preposterous, I would now remind you that the rally from December 2018 until February of 2020 was a VERY large b-wave.
Yet, I am very quick to also remind you that I will not hesitate to move to the yellow count if the market should not provide us with a CLEAR 5-wave decline from a high we strike. And, of course, my main reason is because I do not have a reliable way to consider the top to the market as being in place at the 2021 high. And, this should not be news to anyone who has been reading my analysis for the last year and a half.
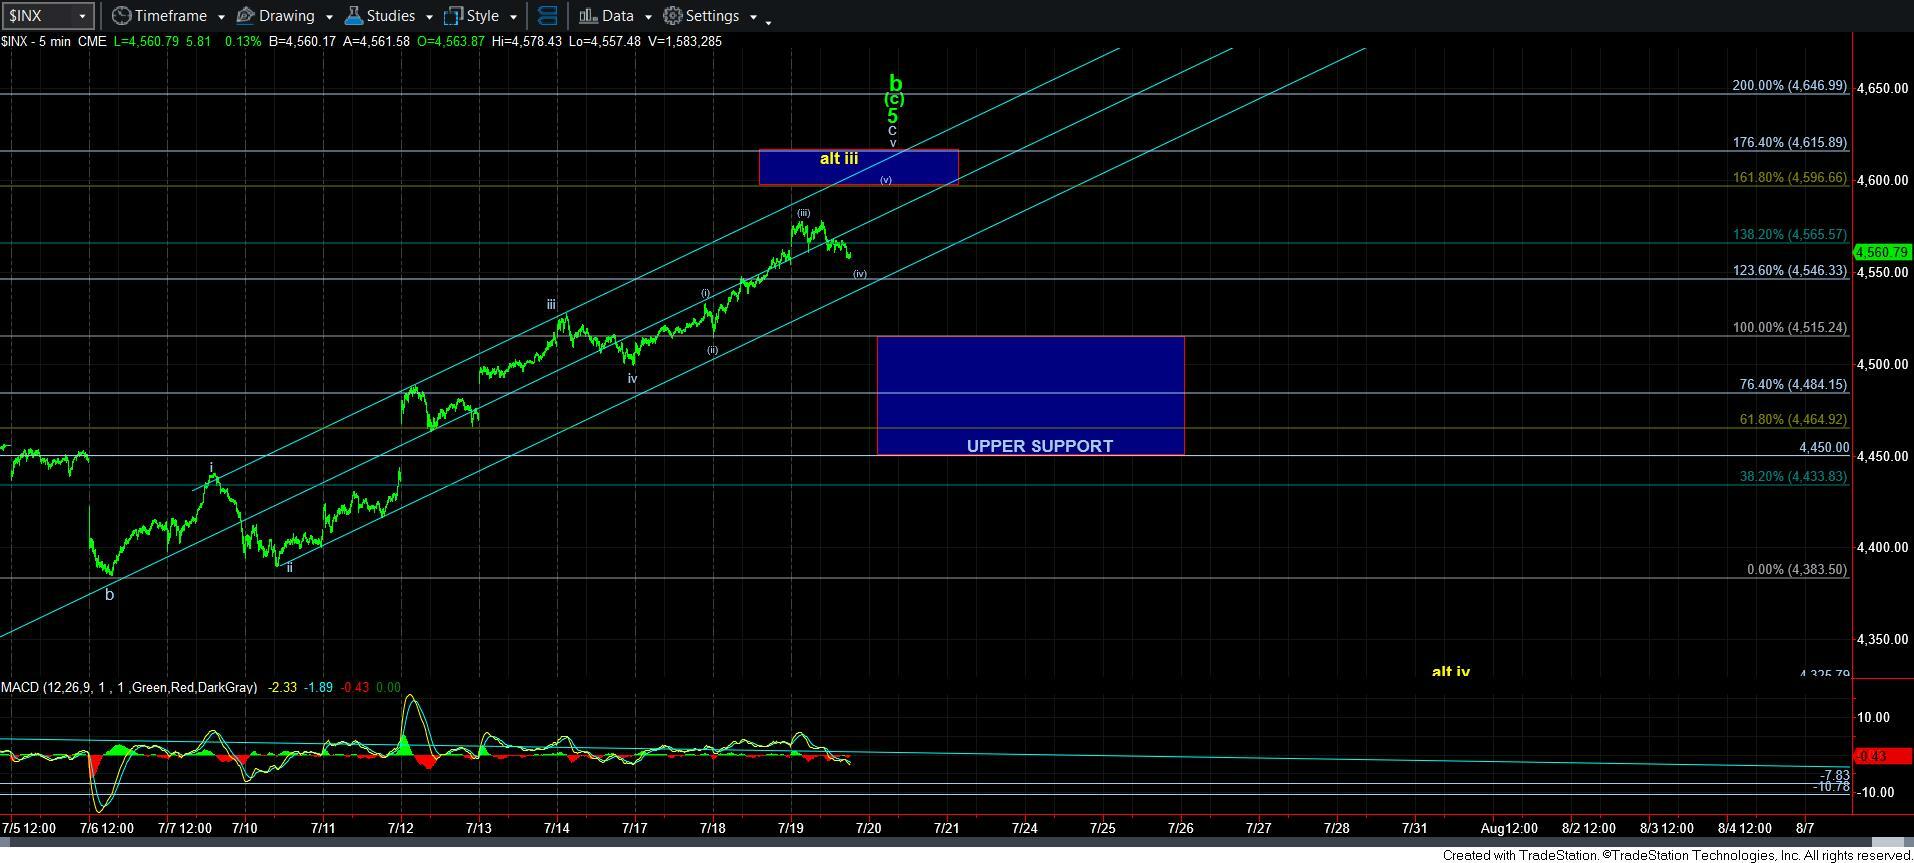
In the smaller degree count, the market has now moved through the resistance we highlighted in the weekend update. So, as I sharpen my pencil, I have moved up to the next Fibonacci extension levels on the 5-minute chart. But, I view this as even greater resistance because it also represents the region in which wave v is equal to .618-.764 the size of waves i-iii off the July 6th low. And, that is usually the maximum size that I find acceptable for a 5th wave.
Moreover, I have added a micro count that suggests that we can push higher one more time to the next resistance region as long as we hold the 4540-50SPX region. Consider this micro-support.
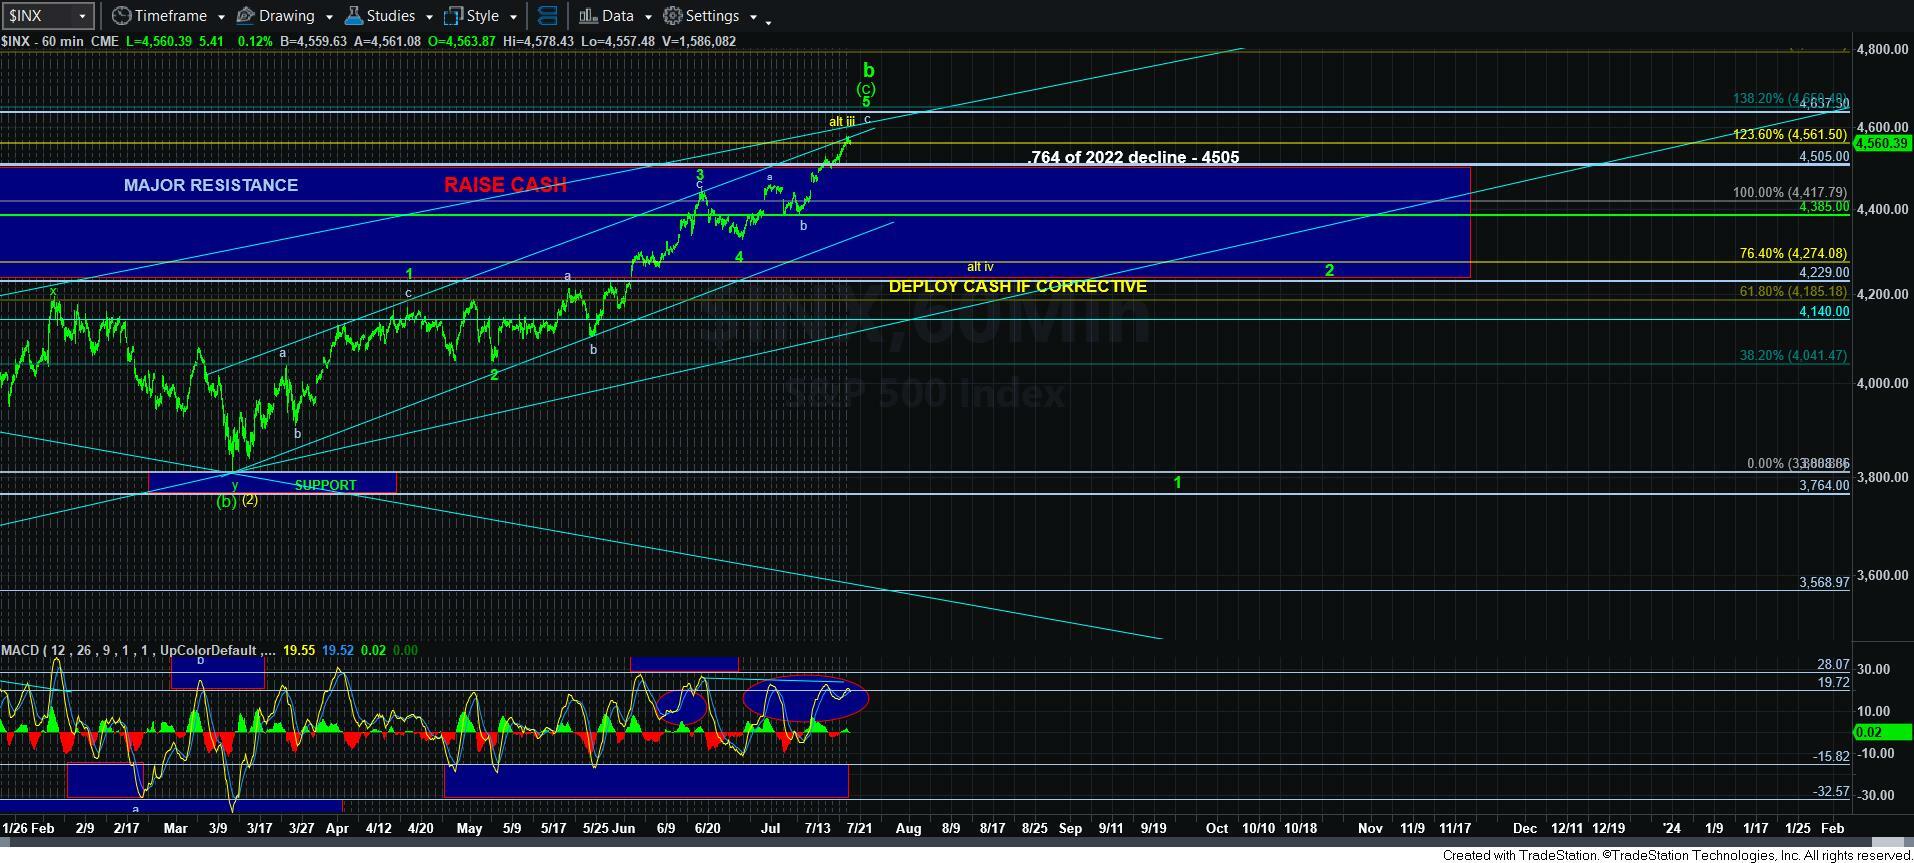
As far as the downside, well, as I noted above, and many times before, while the green count remains my primary, I am keeping a VERY open mind as to how the downside progresses. Our main upper support is in the 4460-4515SPX region, as outlined on the 5-minute chart.
I would need to see a break down of that support to then be able to make a determination as to whether I will be moving into the yellow count, or if we are going to retain the green count as our primary. And, remember, it will all be based upon whether there is a clear 5-wave decline structure taking us below that support or if the break of that support is within a larger corrective structure.
Again, should we see a corrective break down of that support, I will not hesitate to begin looking for opportunities as to where I can add back the cash I took out of the market, and will trade next for a rally to 4800SPX. However, if we see a clear break down in 5-waves, then I will be using the ensuing corrective bounce to short the market in preparation for what will likely be a sizeable c-wave decline.
Lastly, I wish I was able to see the future. I will not be right all the time. Yet, I have provided our members with very clear parameters and expectations during this entire rally. We have strongly urged to avoid shorting and kept our members on the correct side of this rally despite the extreme bearishness we have all felt during this rally off the lows. And, I am quite proud of the guidance we have provided. But, for now, I think we all need to be a bit more patience in order for the market to tell us which direction we need to redeploy our hard earned money.