Topping Region - Market Analysis for Sep 22nd, 2016
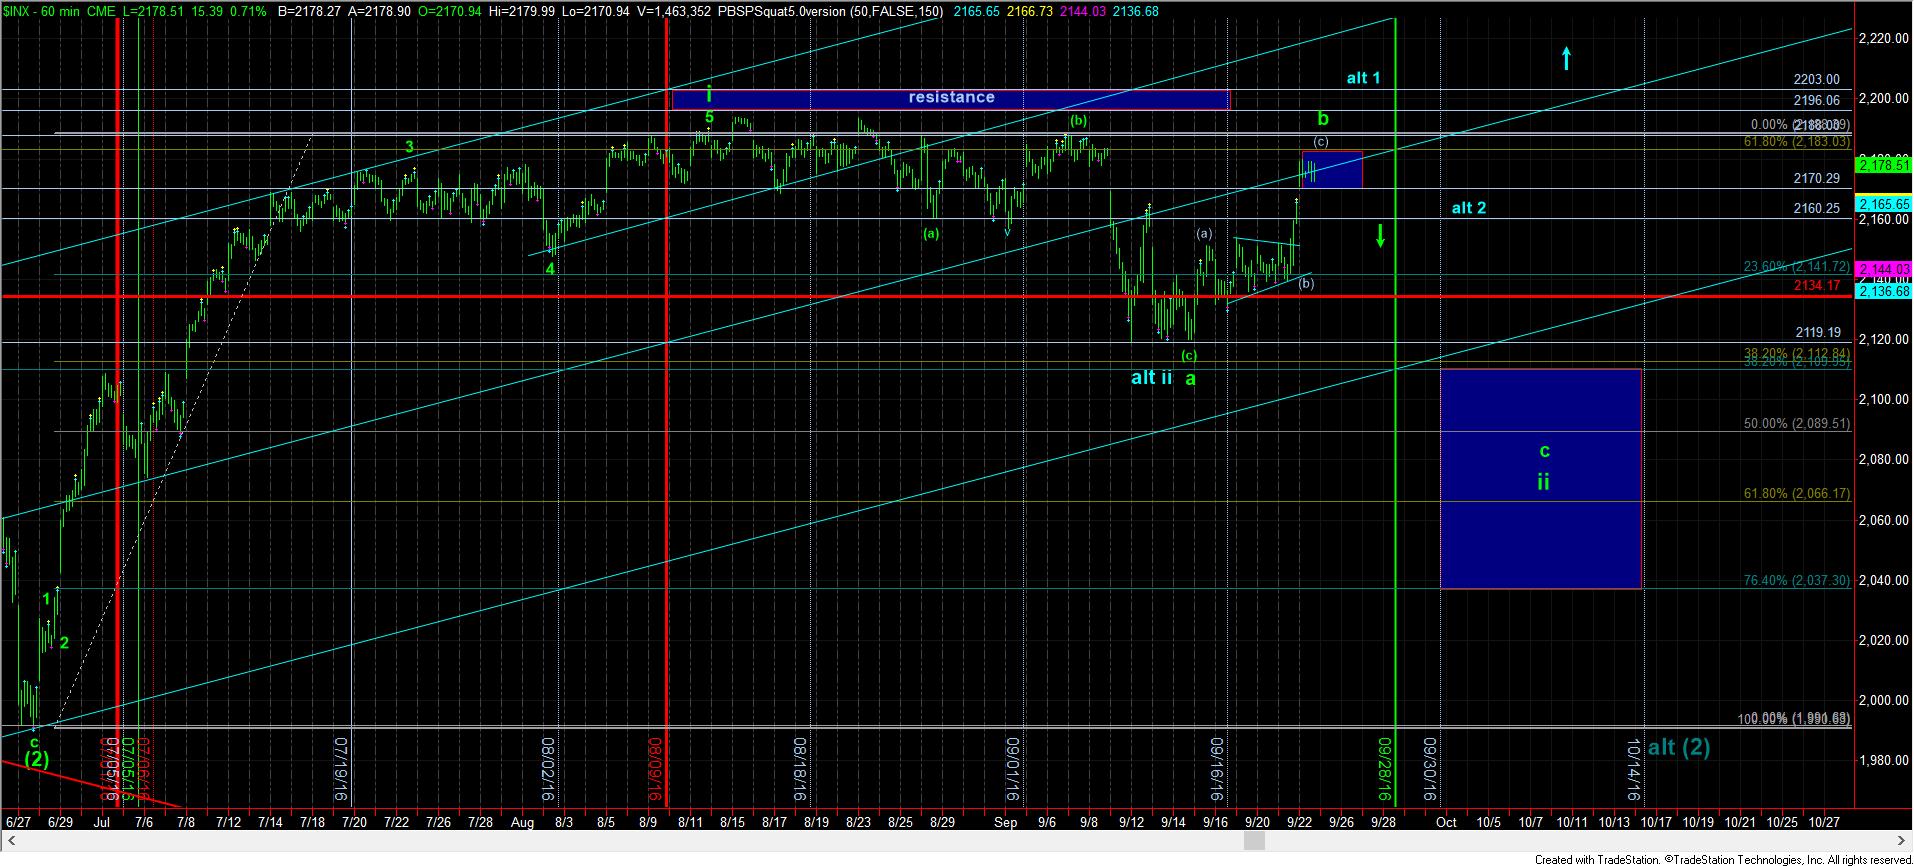
With the continued upside today, the market is in the final stages of what we would consider the (c) of b wave. As the micro count now stands, it looks as though the 2183SPX region will be tested, and maybe even slightly exceeded to complete this (c) of b.
Our primary expectation at that time would be a c-wave to the downside, pointing to our blue box below. As you may have noted, I had to enlarge that box higher because of how high we have traveled in this b-wave. You see, the .382 retracement of wave I resides at the 2110SPX region, and the (a)=(c) projection for the c-wave would be targeting that exact region. So, unless I see a very large wave 1 down for the c-wave, I have to view the potential that we may not break the 2110SPX region quite seriously. Once we have the first structure down, which breaks 2160SPX, we will then have a much better idea for a target for the c-wave down, and will be able to fine tune it a bit more as the 3rd wave down in the c-wave progresses.
Alternatively, with IWM and other equity markets making higher highs, we have to also strongly consider the potential that wave ii is done at our alt ii placement. For confirmation of that, we would need to see 2162SPX hold on all pullbacks, and then make a higher high for a 5th wave in alt wave 1. At that point, that is a VERY strong warning to anyone who is bearish. If we then pullback correctively from that high, and then rally over the top of alt 1, that is our signal that we are likely on our way to 2350SPX, and potentially by year end.