Tomorrow Will Provide Answers For SPX
With the market bottoming yesterday in what I am primarily viewing as the (a) wave within the e-wave of the triangle we have been tracking, we have seen a sizeable rally back up into the region within which we have been consolidating for several weeks.
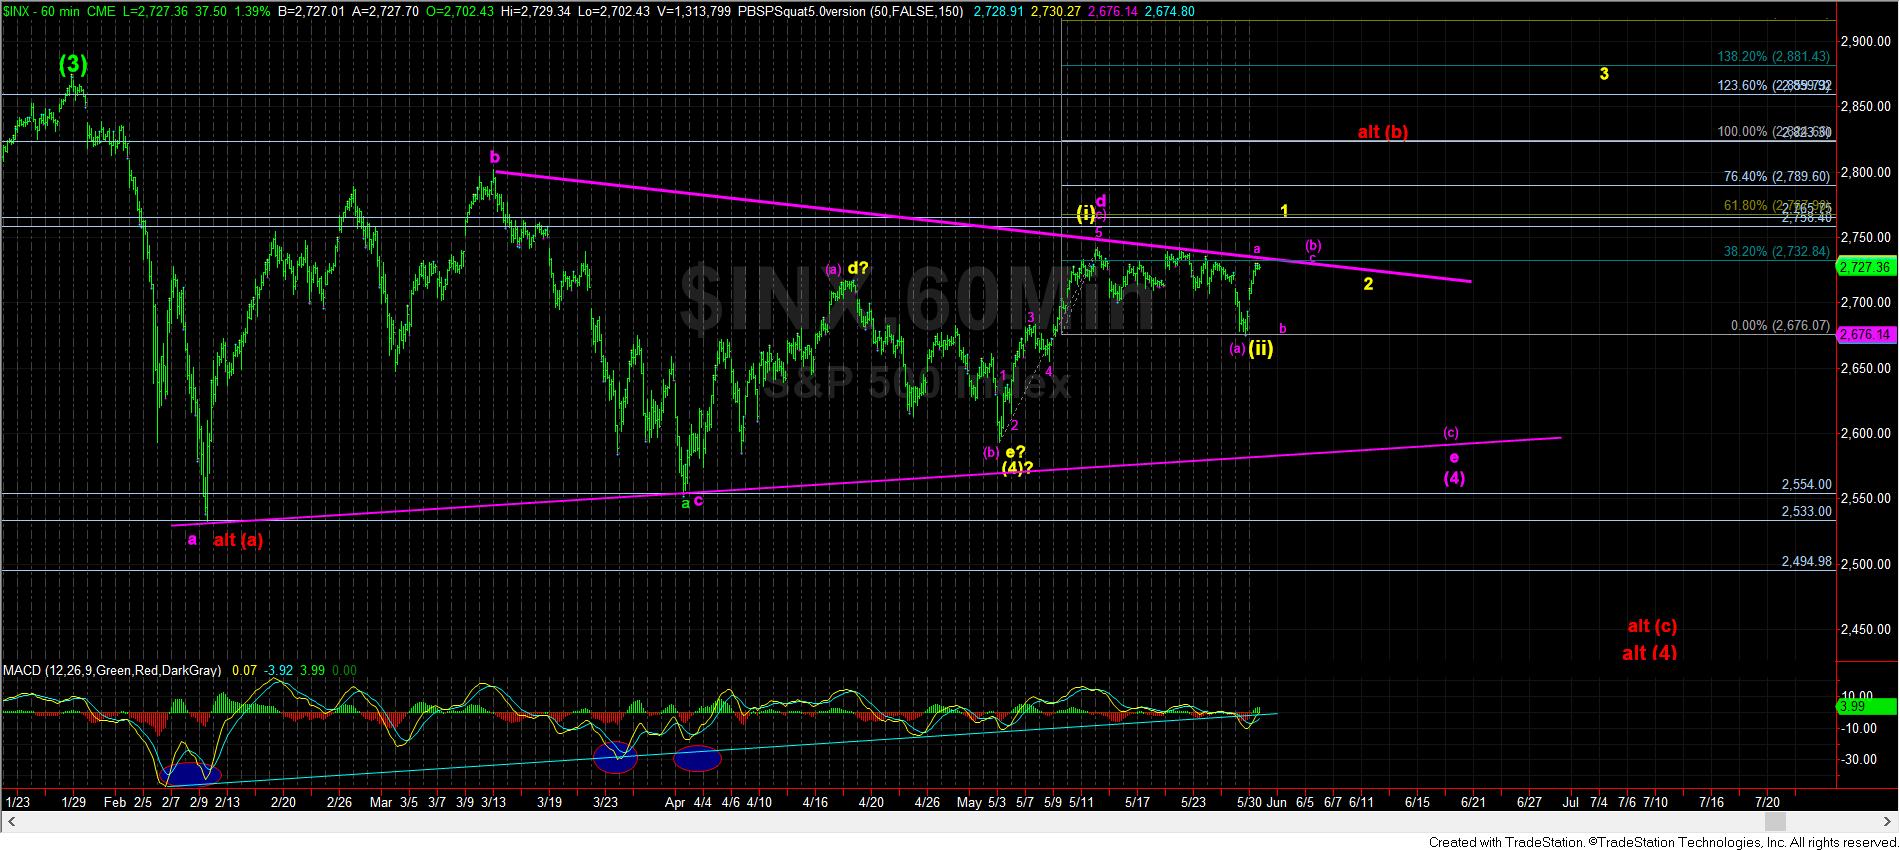
But, this move up suggests that the market will have decision to make into tomorrow. You see, in the primary wave structure, this seems to be an a-wave within the (b) wave of the e-wave, as presented on the 60-minute chart. While many of you have asked me why it cannot be all of the (b) wave, my answer is that it can, but, based upon the size of the (a) wave, I would expect the (b) wave to be a bit more protracted in time. That is why my primary count is looking for a (b) wave flat in this region.
However, as we have noted time and again, it is not likely that this bull market has yet seen its highs. So, we have been tracking a possible more immediate bullish count, which is presented in yellow on my 60-minute chart. Moreover, should the market be able to break out strongly through the 2731ES region, it would make this potential a much higher probability. In fact, such a break out is likely pointing us up towards the 2765SPX region to complete wave 1 of wave (iii), and set us up for a wave 2 pullback into the month of June, as outlined on my 60-minute chart.
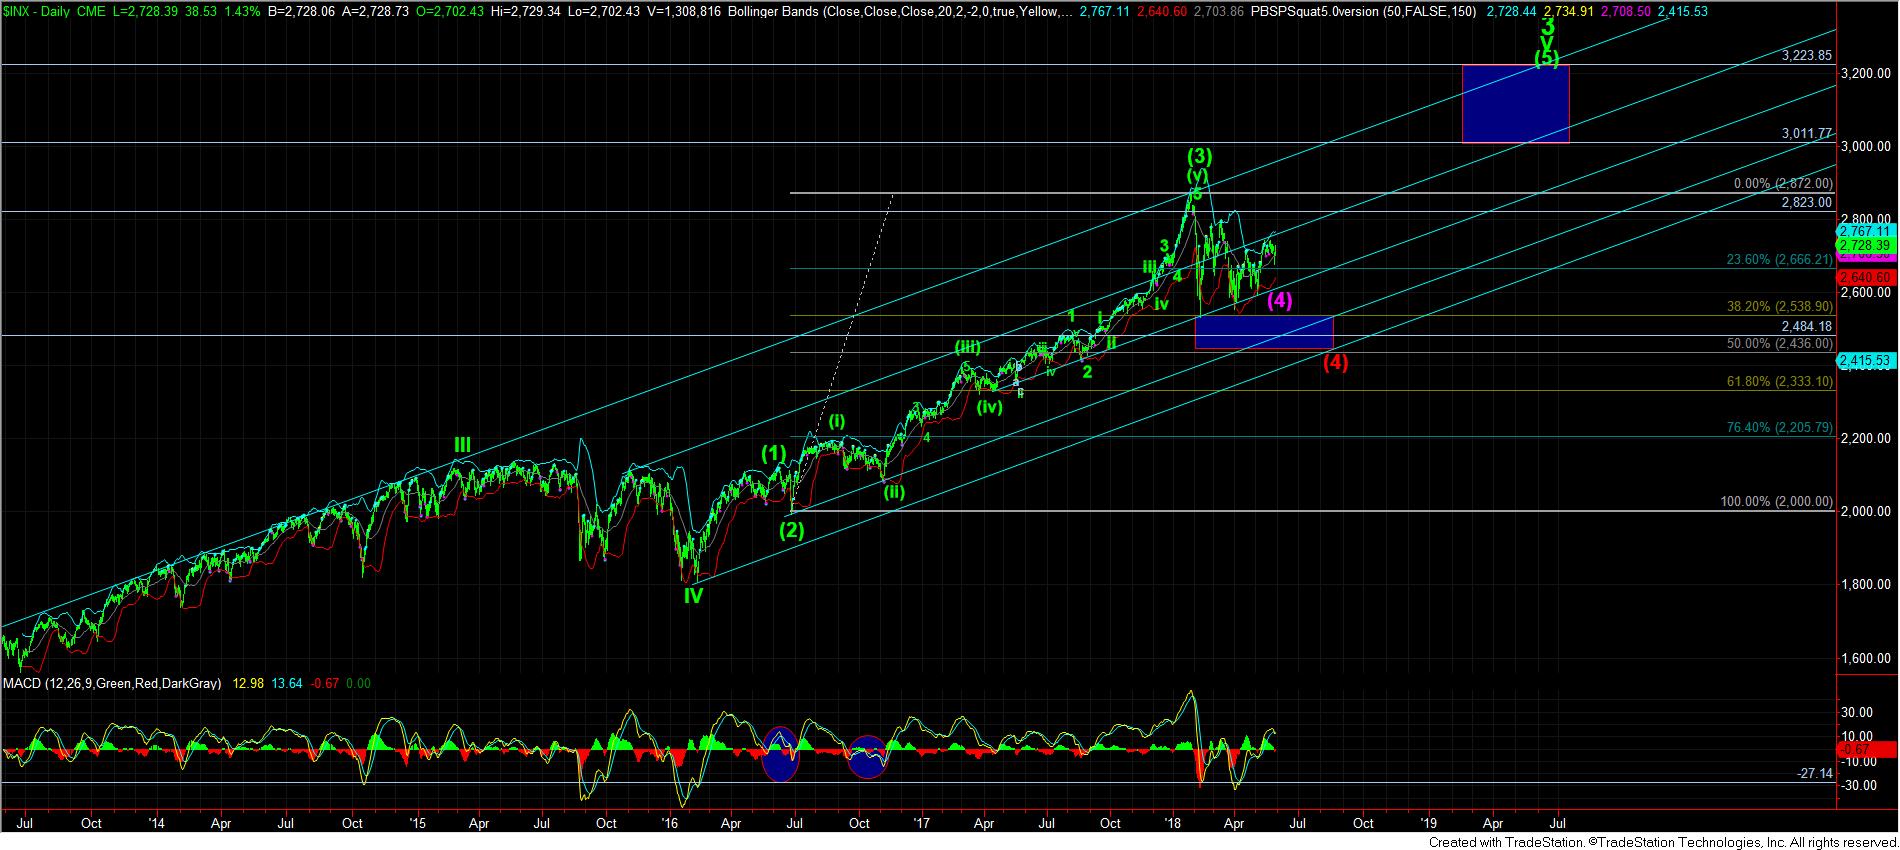
Please do take note that if this count takes the market higher sooner rather than later, it suggests that we may not see the upper end of our target for wave (5) of v of 3 on the daily chart, and we can even top within 2018. The only way we would be able to see upper end of our target region in this more immediate bullish set up is if the market provides very strong extensions beyond the standard extension in wave (iii). But, there is no way we can make any assumptions about that at this time.
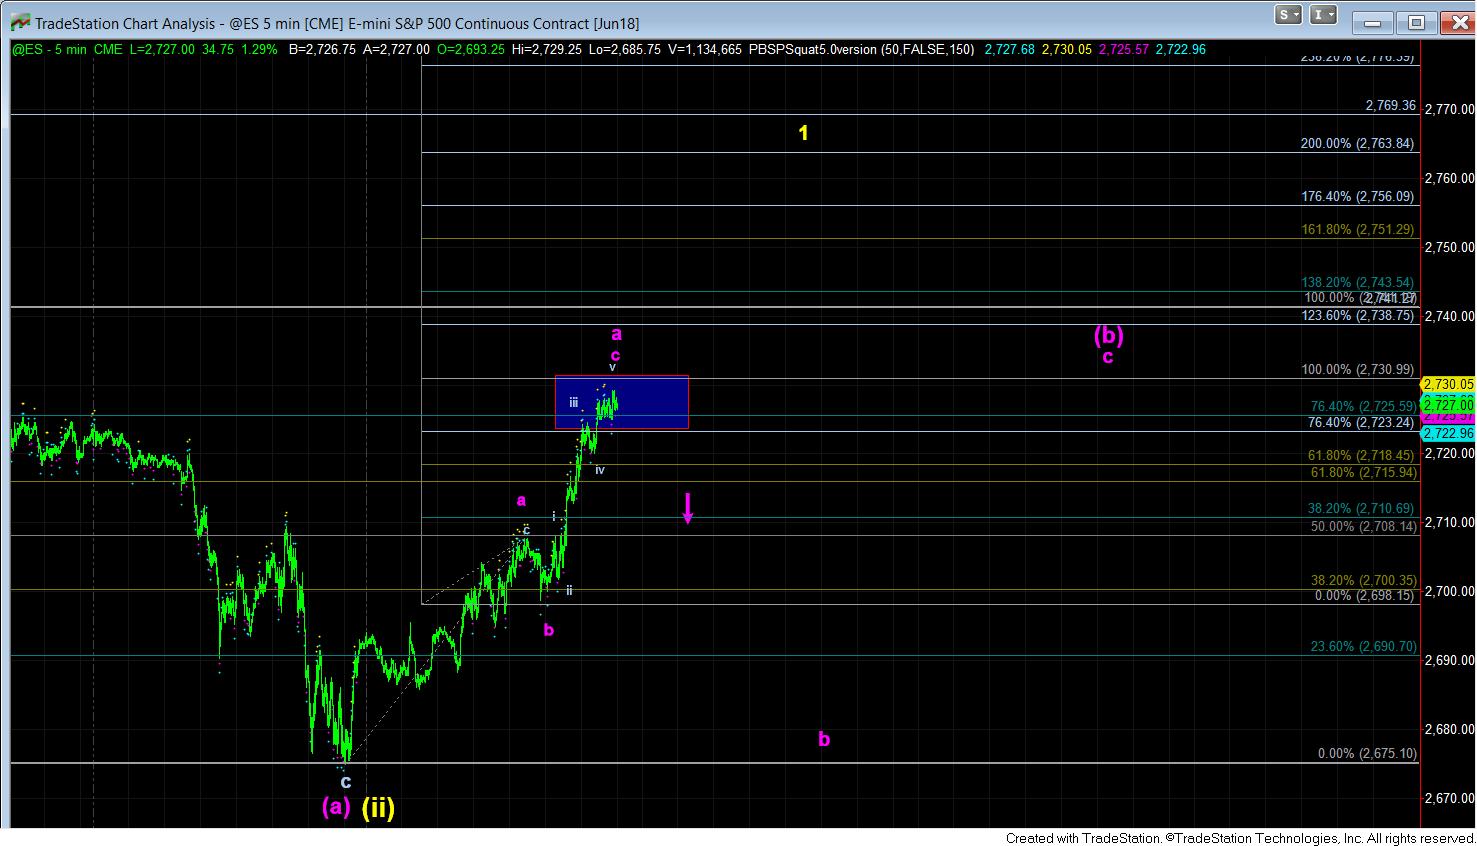
Yet, as long as we remain below 2731ES, I still think this 4th wave can take us a bit longer before we are ready to rally to the 3000 region. It would take a further break down below 2718ES to suggest we are dropping in the b-wave of the (b) wave, as shown on the attached 5-minute ES chart.
So, it seems the market has a decision to make into tomorrow as to whether it wants to be a bull sooner rather than later. But, most of what we are viewing still suggests that 3000 is coming . . . but it is just a matter of time now.