Today’s Spike High Is EXTREMELY Important
With the market breaking down below the 2730 region, it opened the next downside path that we are seeing today. And, as usual, the market has been providing us some insane downside extensions during this decline.
So, let me start by addressing what I was posting about last night once we broke below support.
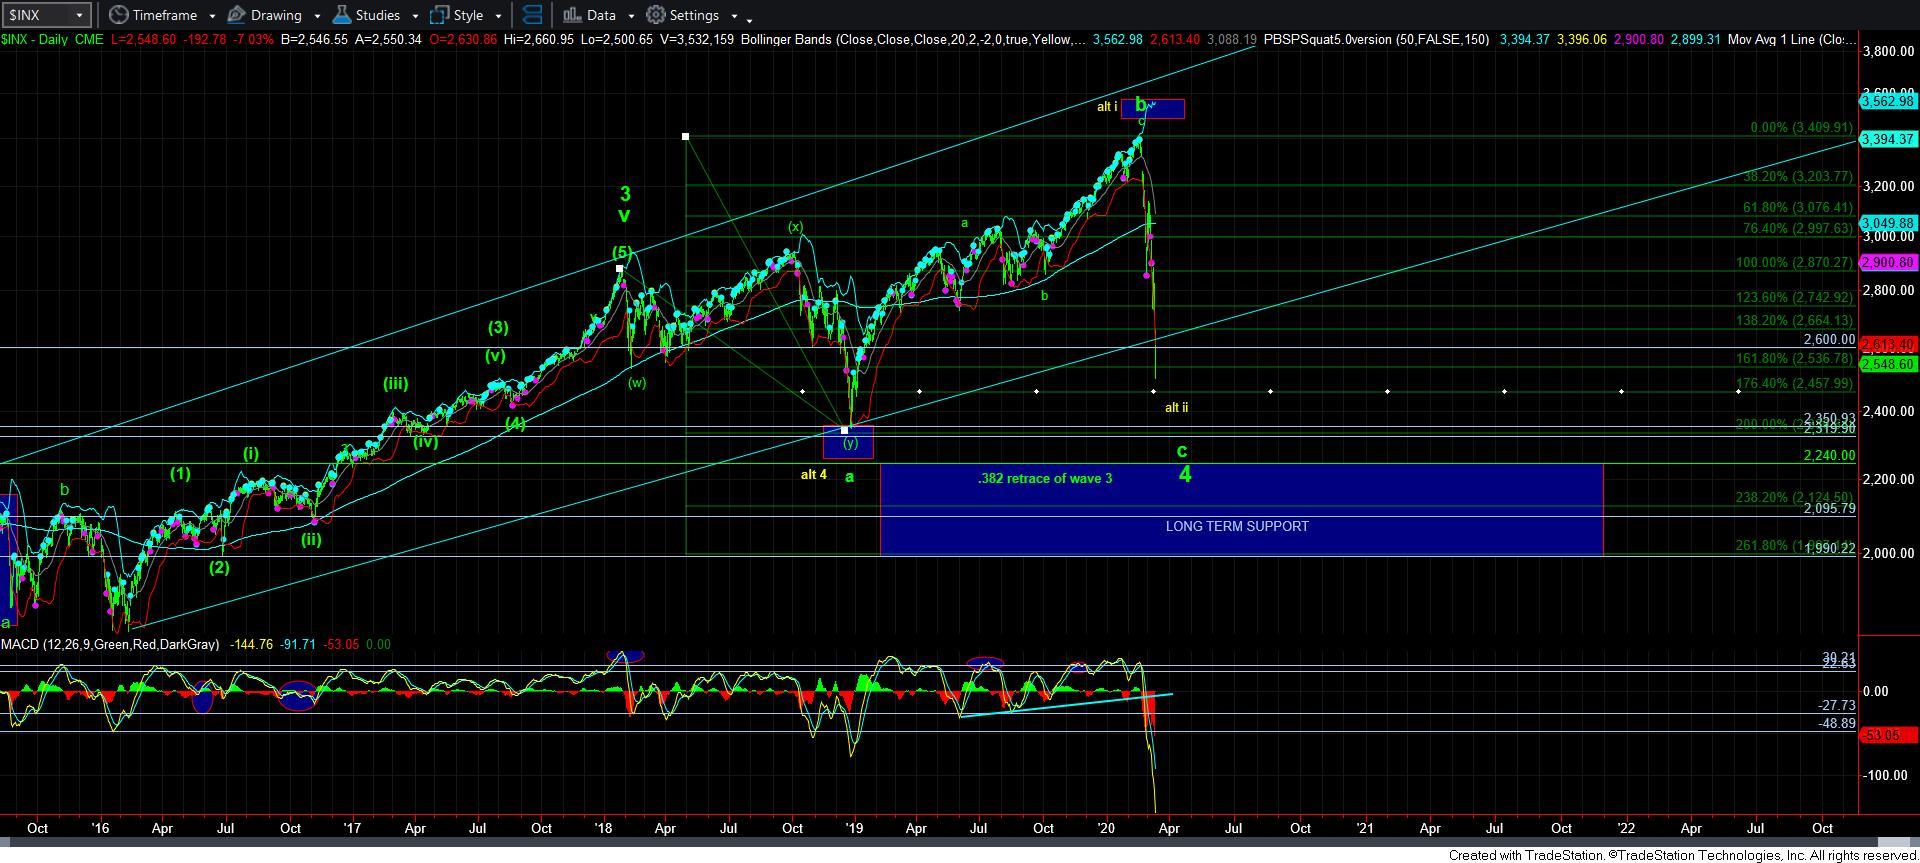
First, I have moved into the c-wave of 4 being my primary count in SPX, which now matches my expectations for the EEM and IWM.
Second, in both the IWM and SPX, it would seem the market is still trying to complete wave 3 of that c-wave decline.
Third, we MUST move back over the spike high we struck today in the ES, or else the market could be setting up another extension in the 5th wave of the 5th wave of this 3rd wave down into the 2300’s. Yes, I know this downside has already been historic, but the market is going to have to move over today’s spike high to begin a wave 4 bounce. It is that imperative to the bigger potential we are now seeing. So, downside risk does not diminish until we are able to rally over today’s spike high in the 2650 region. Otherwise, this 3rd wave can extend down into the 2300’s.
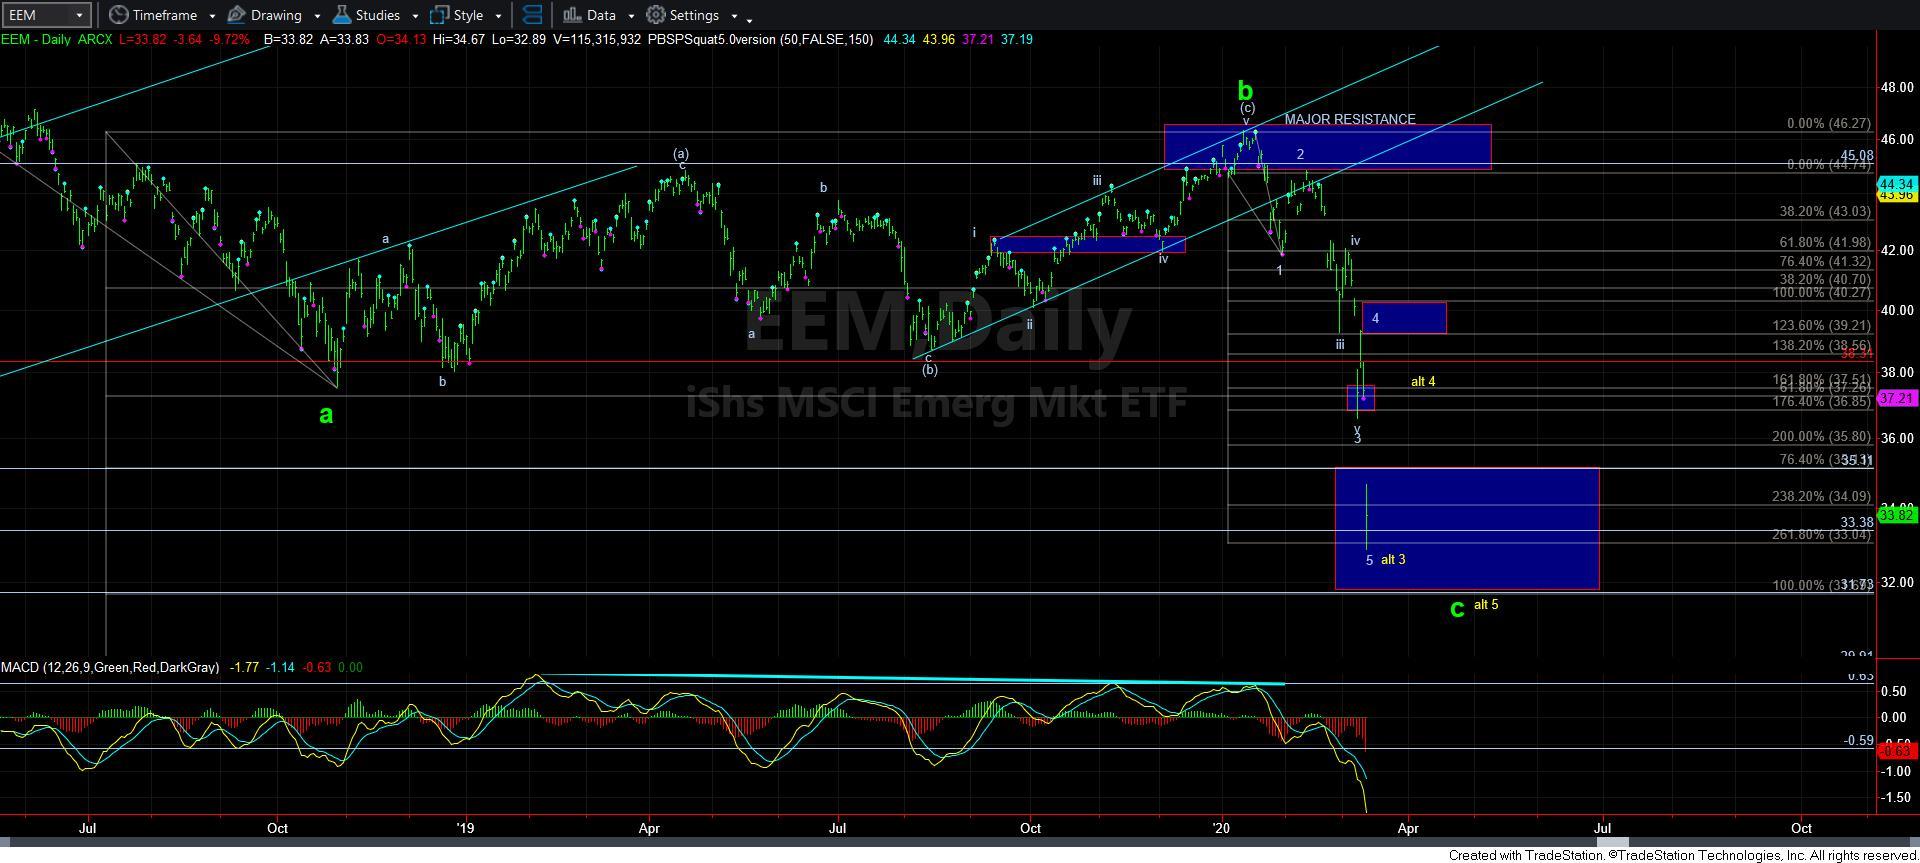
This brings me to another point that I am compelled to make. The EEM has been one of the main indicators for this decline, as I was highlighting back in January and February with the 1-2 downside set up we were developing. As it stands today, I can now count 5-waves down in the EEM, with perfect strikes in Fibonacci Pinball, albeit with this last extension being quite extreme. The only indication that I have that this decline is not yet complete is the fact that the MACD on the daily chart is still pointing down hard. But, with a completed 5-waves down, I am going to watch to see how the next rally takes shape. If it is a clear 5-wave structure, then I am going to view the EEM as having potentially bottomed. However, if the next rally is clearly corrective, then I will view it as the alternative count in yellow, which would still align with my expectations in IWM and SPX.
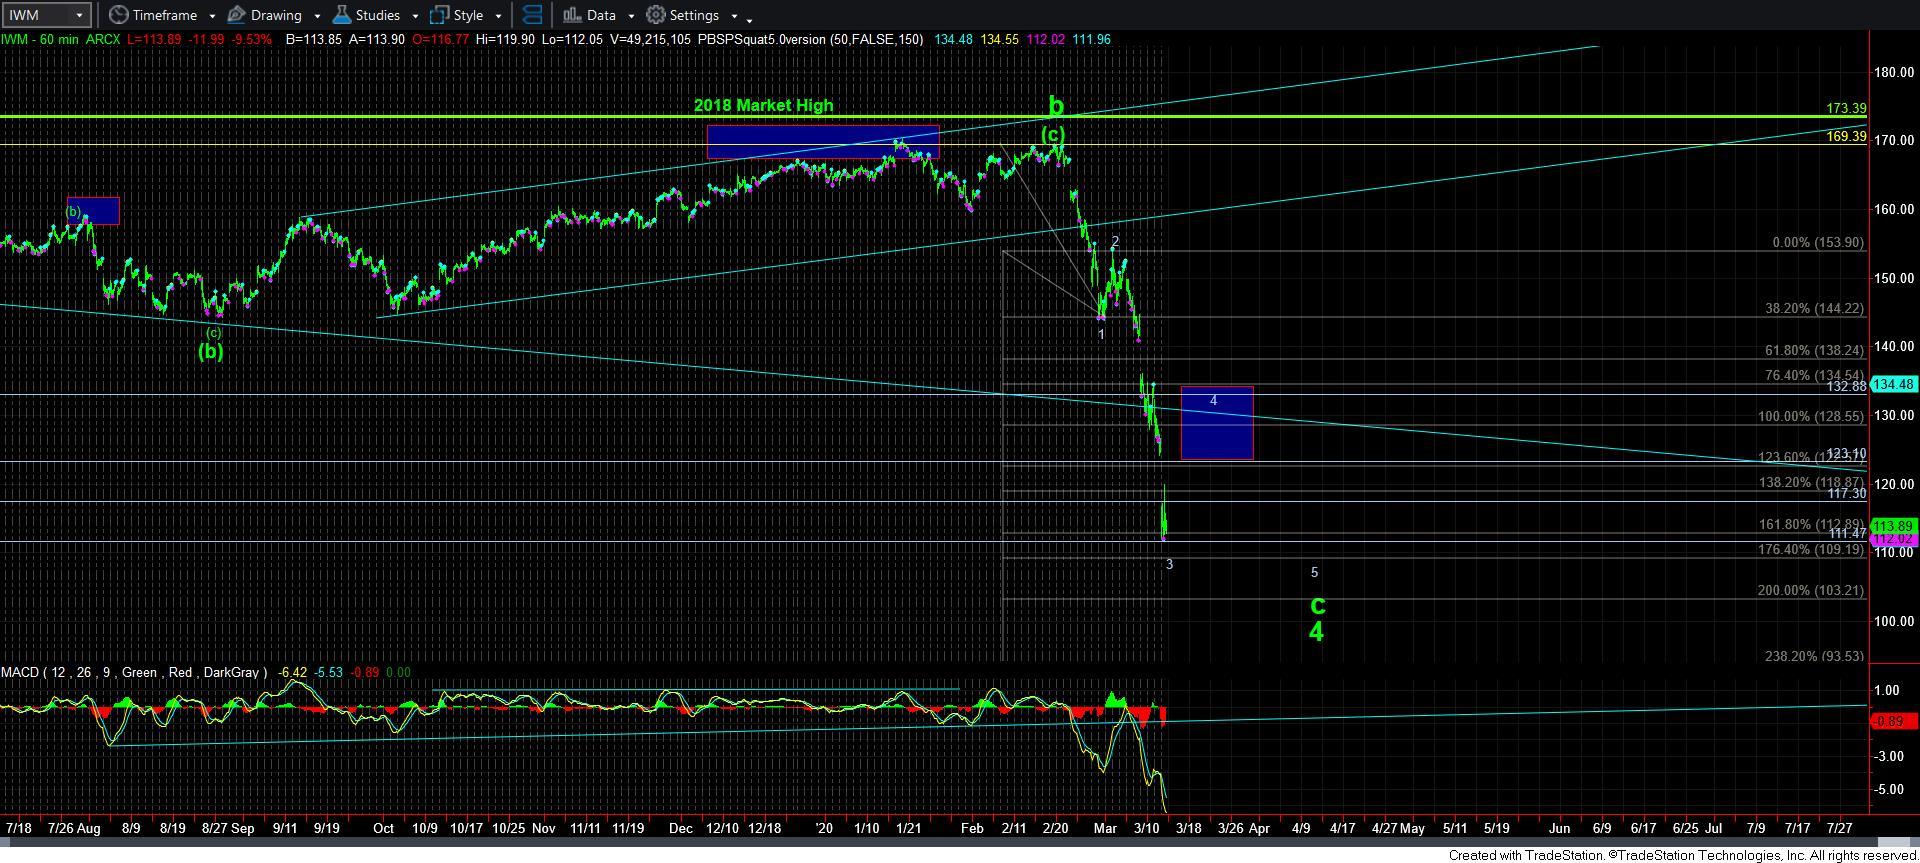
As far as the IWM, the ideal target for a 4th wave bounce is in the 129 region. But, just like the SPX, we will need to exceed today’s spike high to make that a higher likelihood. And, in order to see the technicals come off the floor, I am going to expect that we can grind around in that 4th wave for at least a week or two. Since wave two was quite small (and I have slightly adjusted my count on this decline, as you can see from the 60-minute chart), I would expect the 4th wave to take us a bit of time based upon the theory of alternation.
Overall, the main point is that most charts still suggest we need another 4-5 before this decline completes. Yet, it is possible that the EEM may have bottomed earlier than the others, but I am going to need see better proof of that potential in the coming week. Otherwise, I will be looking for that dreaded lower low for a 5th wave in all the charts we track in the coming weeks. And, I am not really able to identify the points at which we can expect a bottom until I see more confirmation as to where this 3rd wave decline completes.