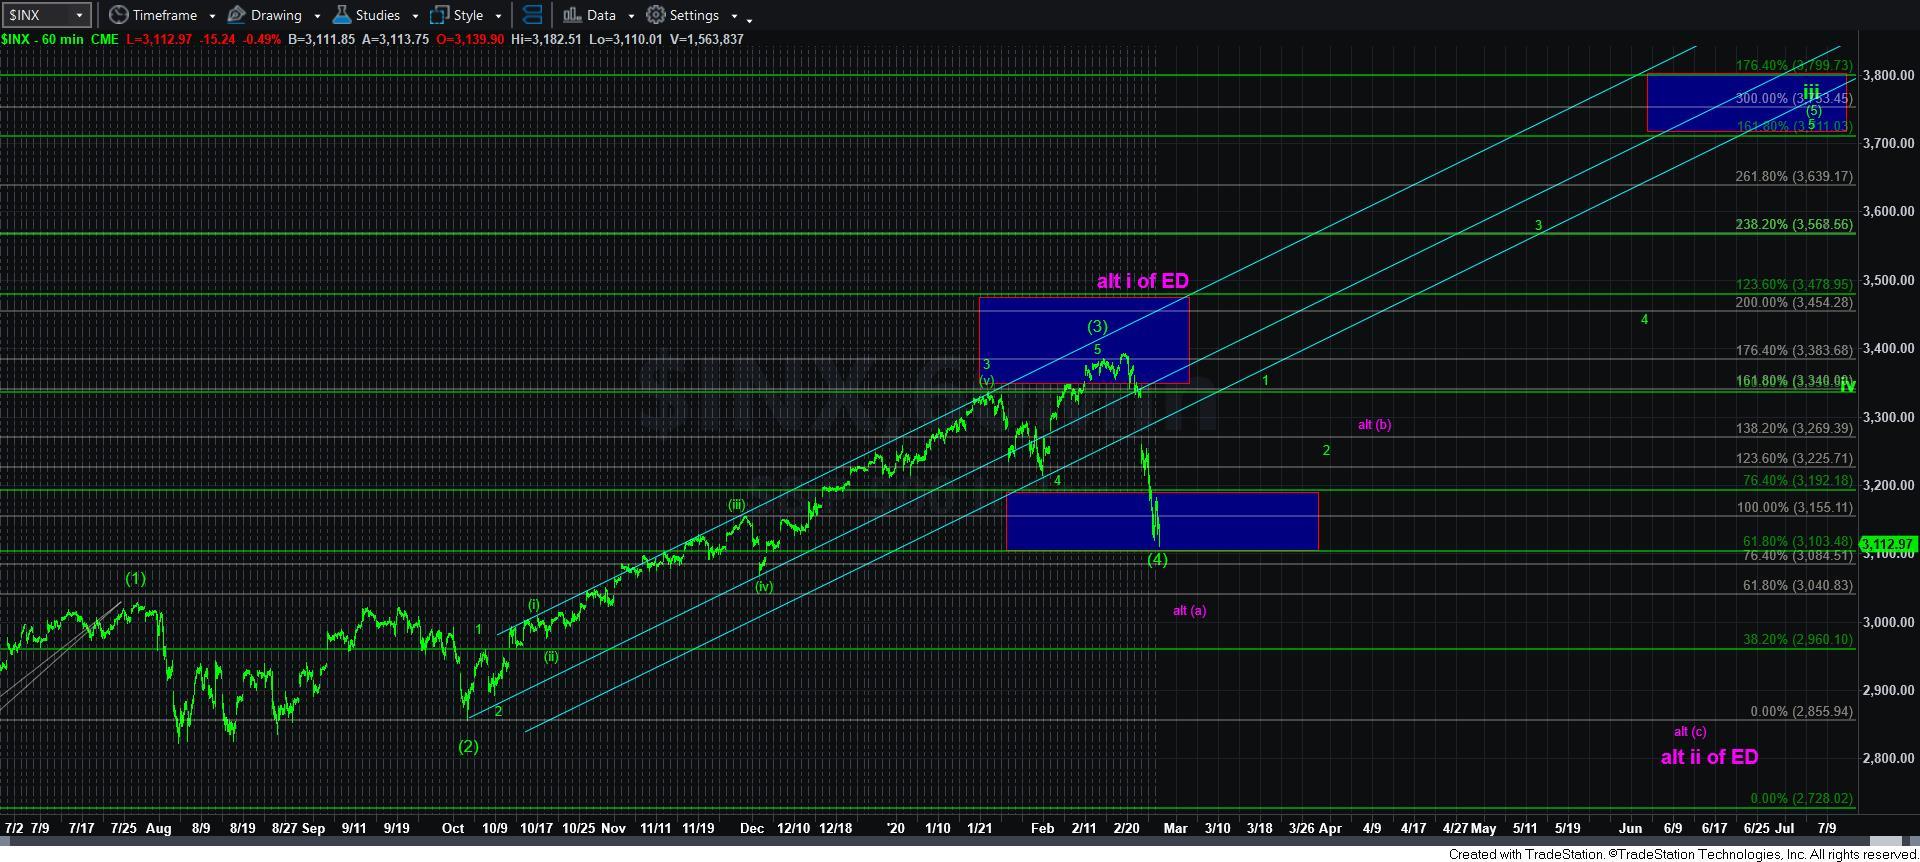
Today’s High Becomes Important
With the market approaching the 3100 last support region for the green count in the SPX and a wave [4] bottom, today’s high becomes quite important. You see, we can count 5-waves down off today’s high, which keeps pressure down as long as we remain below today’s high.
So, if the market is unable to break back over today’s high, then pressure will remain down for what will likely be an extension to the [a] wave in the SPX in the purple alternative, most specifically we see a strong break of the 3100SPX support region.
What this means is that a break down below 3100 will shift the probabilities towards us seeing much lower levels in the coming months. However, we really should see an interim [b] wave rally before those much lower levels are seen.
So, clearly, the current region is of utmost importance between these two wave structures.
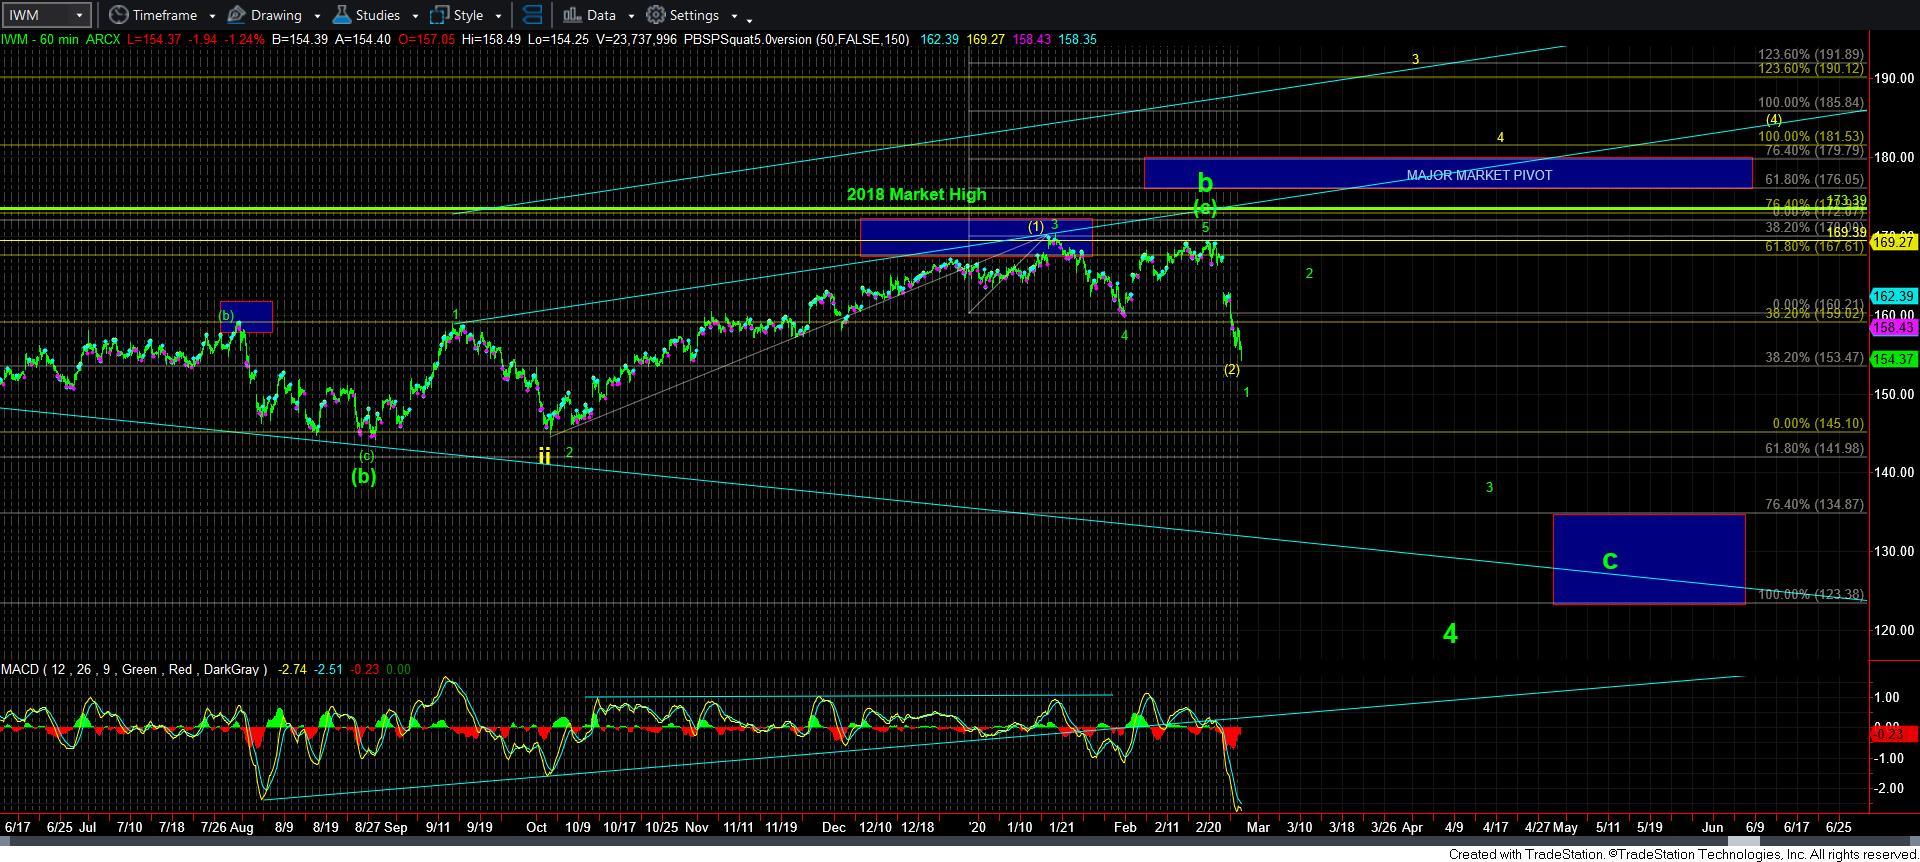
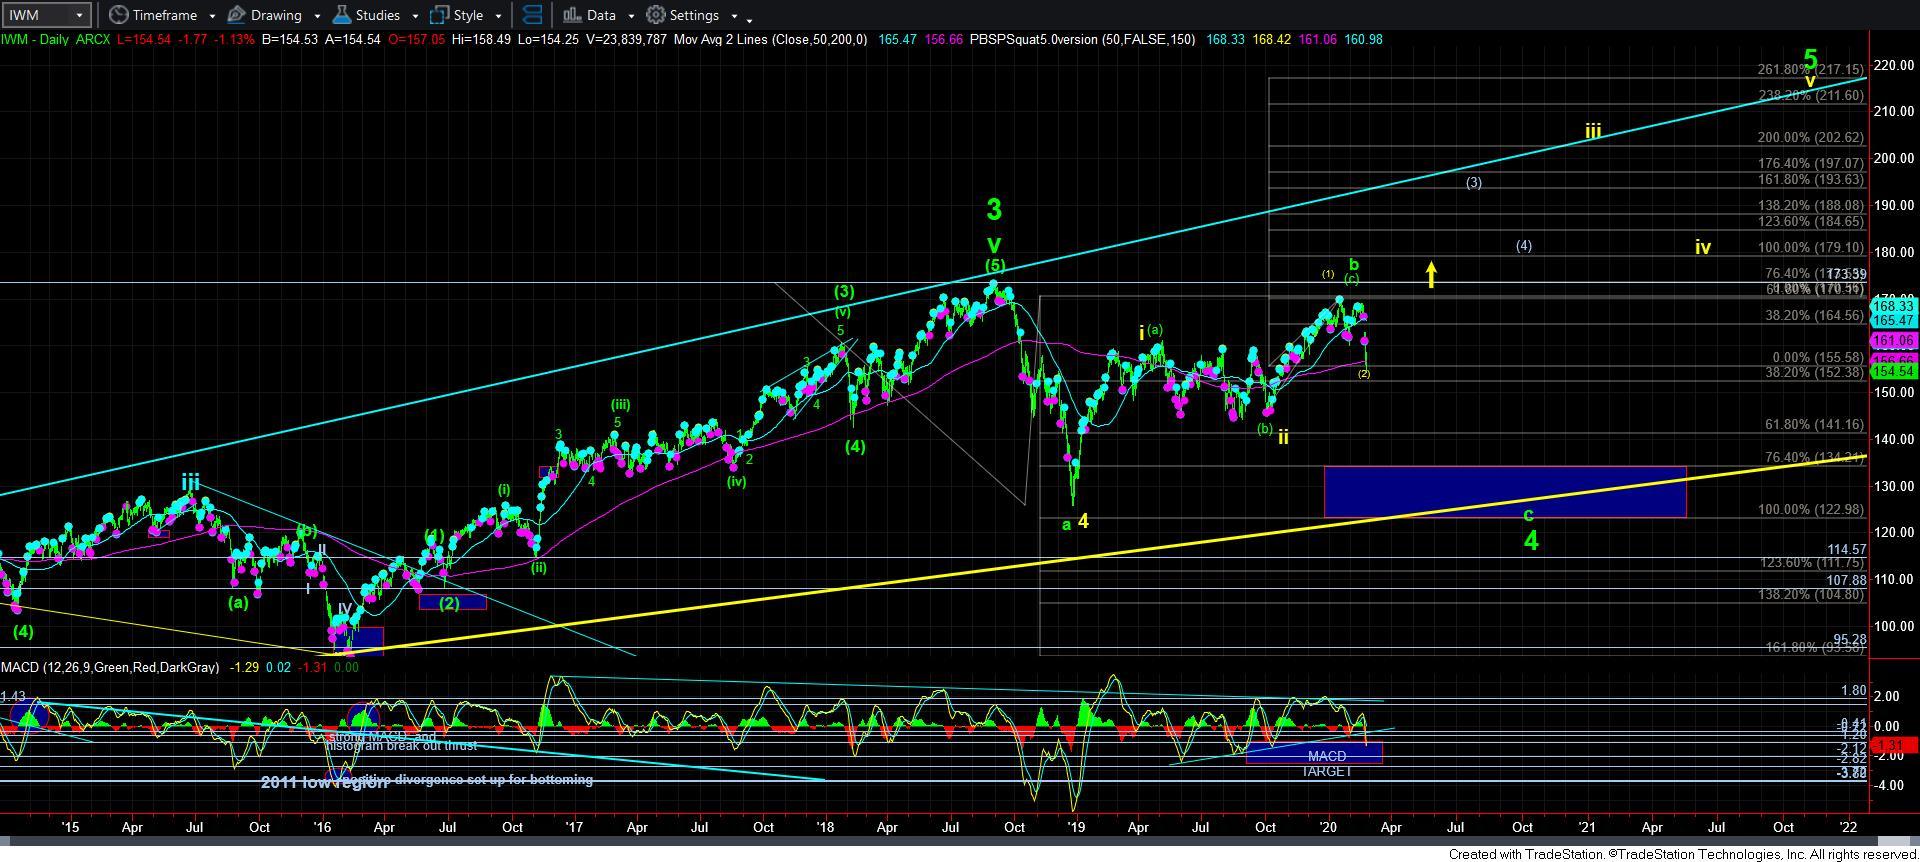
Should we see that break down below 3100SPX, I have added how I would be viewing the IWM on the attached 60-minute chart. A further decline would likely complete wave 1 of the c-wave down in green, likely to be followed by a wave 2 corrective rally before we see a much more significant drop.
Based upon the current structure in the IWM and if the alternative count becomes applicable, the ideal target will be the 123 region, wherein a=c, the standard target for a corrective decline. And, once we have a bottom to wave 1 down, I should be able to triangulate a relatively accurate target for that wave 2 rally.
So, in the near term, 3100SPX and 3183SPX are going to be the levels we will be watching over the next day or so to resolve how we should be looking at the current larger degree market structure.
The last point I want to make is something I was posting last night about the ALTERNATIVE purple count. Again, this is only applicable if we see a sustained break below the 3100SPX region.
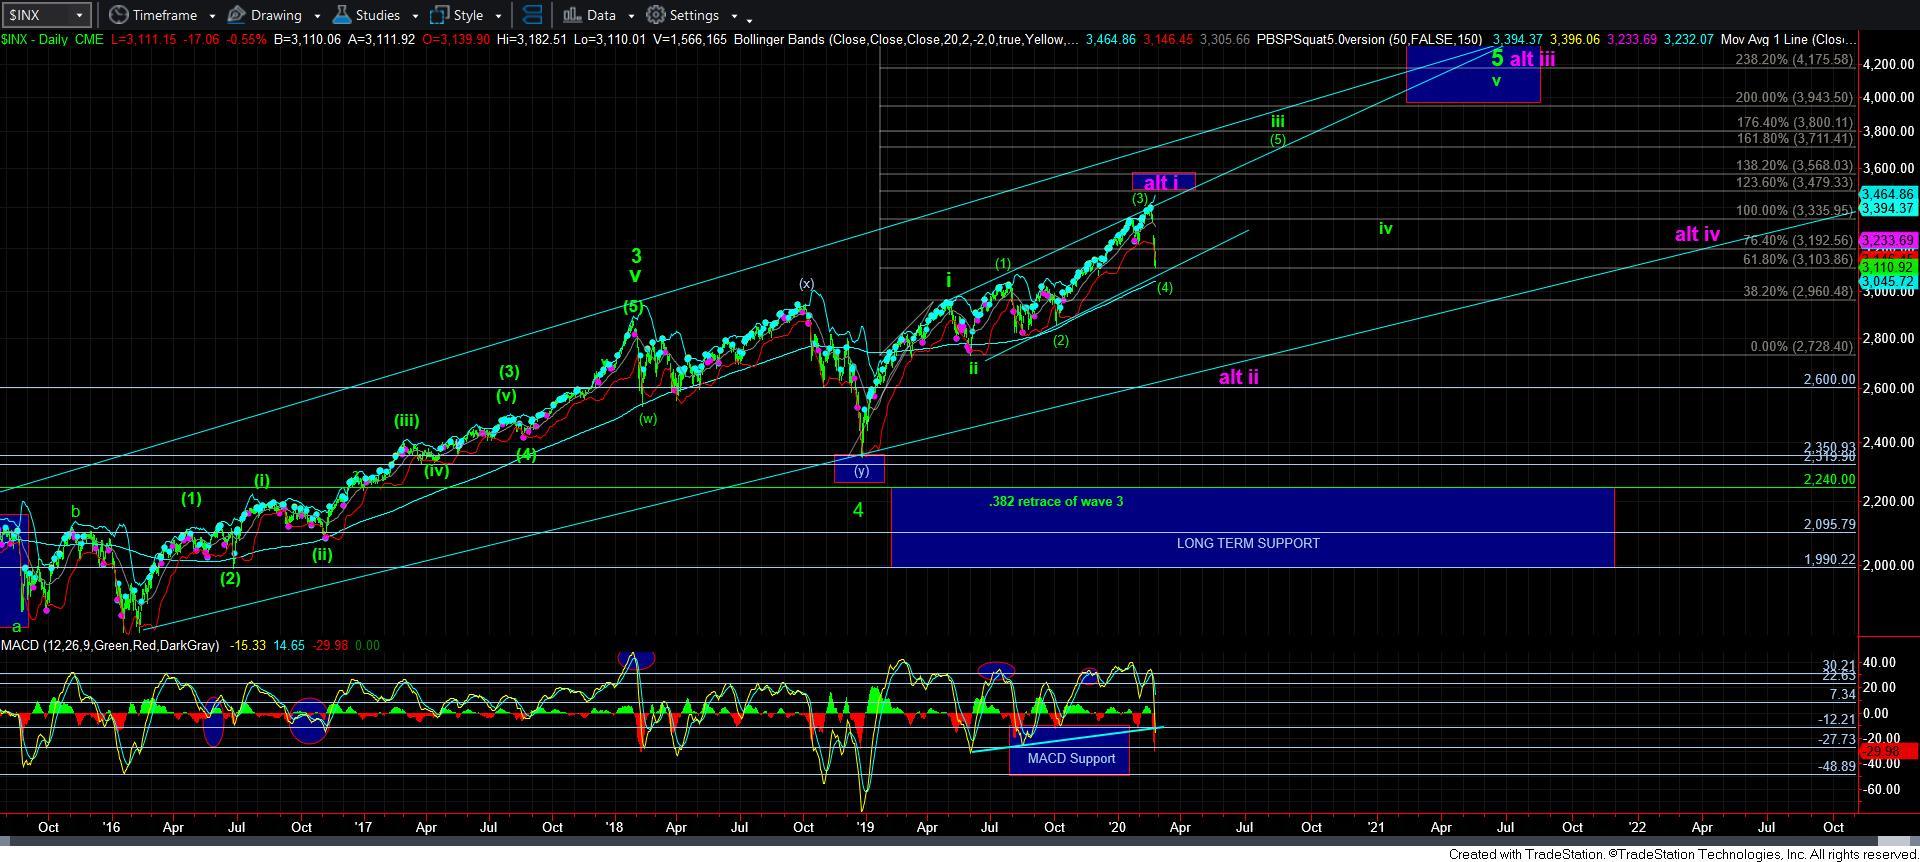
In order to align the IWM and SPX in the event the IWM does get that c-wave down, I am would view the rally off the December 2018 low as the wave i of a much larger degree ending diagonal for our 5th wave off the 2009 lows. That would place our wave iii in the 4000 region, and our wave v in the 4300-4600 region. But, again, I want to stress that is ONLY upon a break down below the 3100SPX, which can be seen as early as this week for an extension to the [a] wave in purple.
So, as the market will not machinate between 3100 and 3183, the level which breaks first will likely resolve which count we will be tracking for many more months to come.