Today Was A Gift From The Trading Gods
When I view a chart, I am always looking towards the simplest and standard pattern I can find on a chart. I have learned that keeping it simple usually provides you with the correct answer to the market. And, that is why I use standards when I analyze a chart.
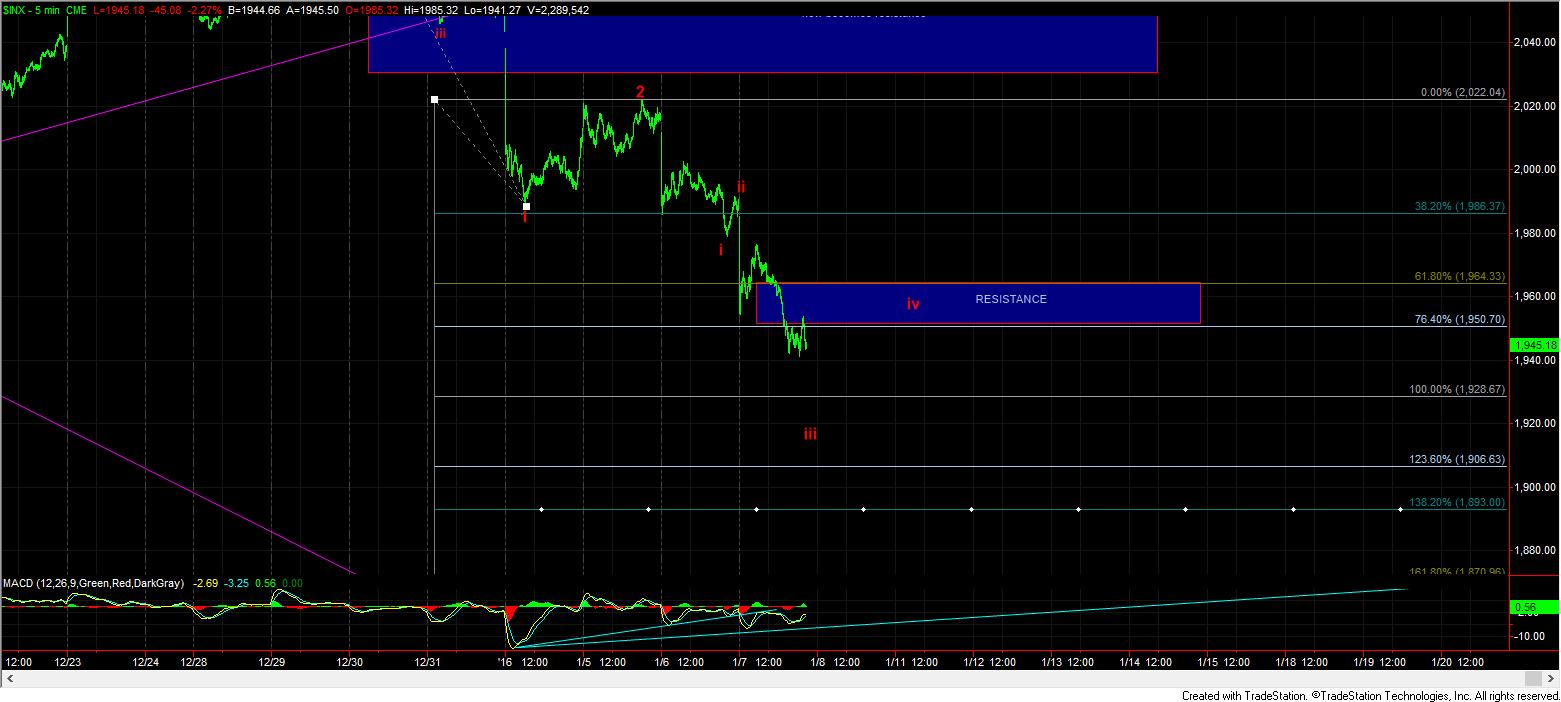
If this chart is impulsive down, it has provided us with anything but standard patterns. If this is going to present an impulse down off the high, the wave 1 is not “standard,” as it counts a VERY extended 5th wave. Furthermore, wave 2 is not “standard” since it was a very low retracement. Also, wave (ii) of 3 down was not much of a retracement as well. Lastly, the technicals on the 5 minute chart are not indicative of a 3rd wave down. So, there really has been nothing “standard” since we topped a little over a week ago.
But, last night, I was looking for a “standard” corrective wave 2 to take us back up. Yet, the market clearly had other ideas. But, after the market opened, it rallied to the top of my resistance region on the ES chart I put out this morning to allow traders to short the market, and then dropped over 30 points from there. So, today, the trading gods were truly nice to the Elliottwavetraders.
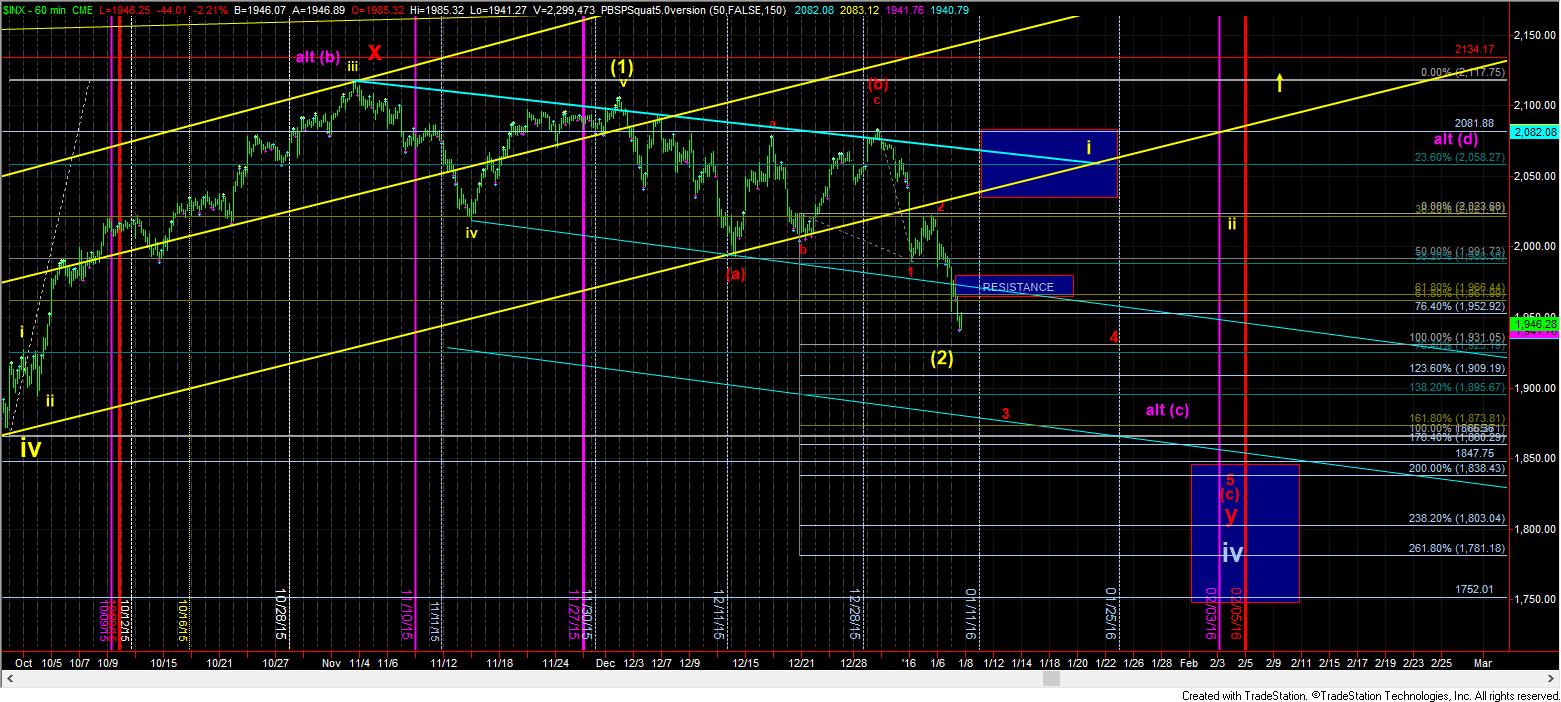
As it currently stands, IF – big IF – the price action wants to continue as a 3rd wave down, we SHOULD be heading down to the 1928SPX level (1.00 extension), and potentially as low as the 1907SPX region (1.236 extension), to complete wave iii of 3. Once that occurs, ALL bounces should maintain below the resistance zone on the 5 minute SPX chart. Should that occur, we should be on our way down to our lower blue box target region on the 60 minute chart.
But, due to the “issues” noted above, I am going to be quite cognizant of the purple triangle potential. So, a lot depends on how the market reacts in this region. But, the lack of support in the techncials, along with the unusual structure seen so far puts me on high alert for this potential. And, this would not likely have us see below the 1900 SPX level. But, should the market turn back up over 1965SPX, then it would make the triangle or even the yellow count - discussed below - much more plausible.
And, for those that want to see the bullish potential – which has a LOT to prove, I would need to see a 5 wave structure to the yellow wave I box above, followed by a corrective wave ii, with us then following the yellow arrow over 2082SPX to get me looking up to 2400. Until that happens, I am looking lower towards the lower blue box, or for the triangle, should the market signal that over the next few days.