Time To Review The Bigger Perspective
With some final squiggles completing to the upside today, we are literally right at the 2850SPX point which can divide this move between something that could head to the 3000 region in the coming months, or where we turn down to remain in the primary count with a much bigger wave (4) still to come.
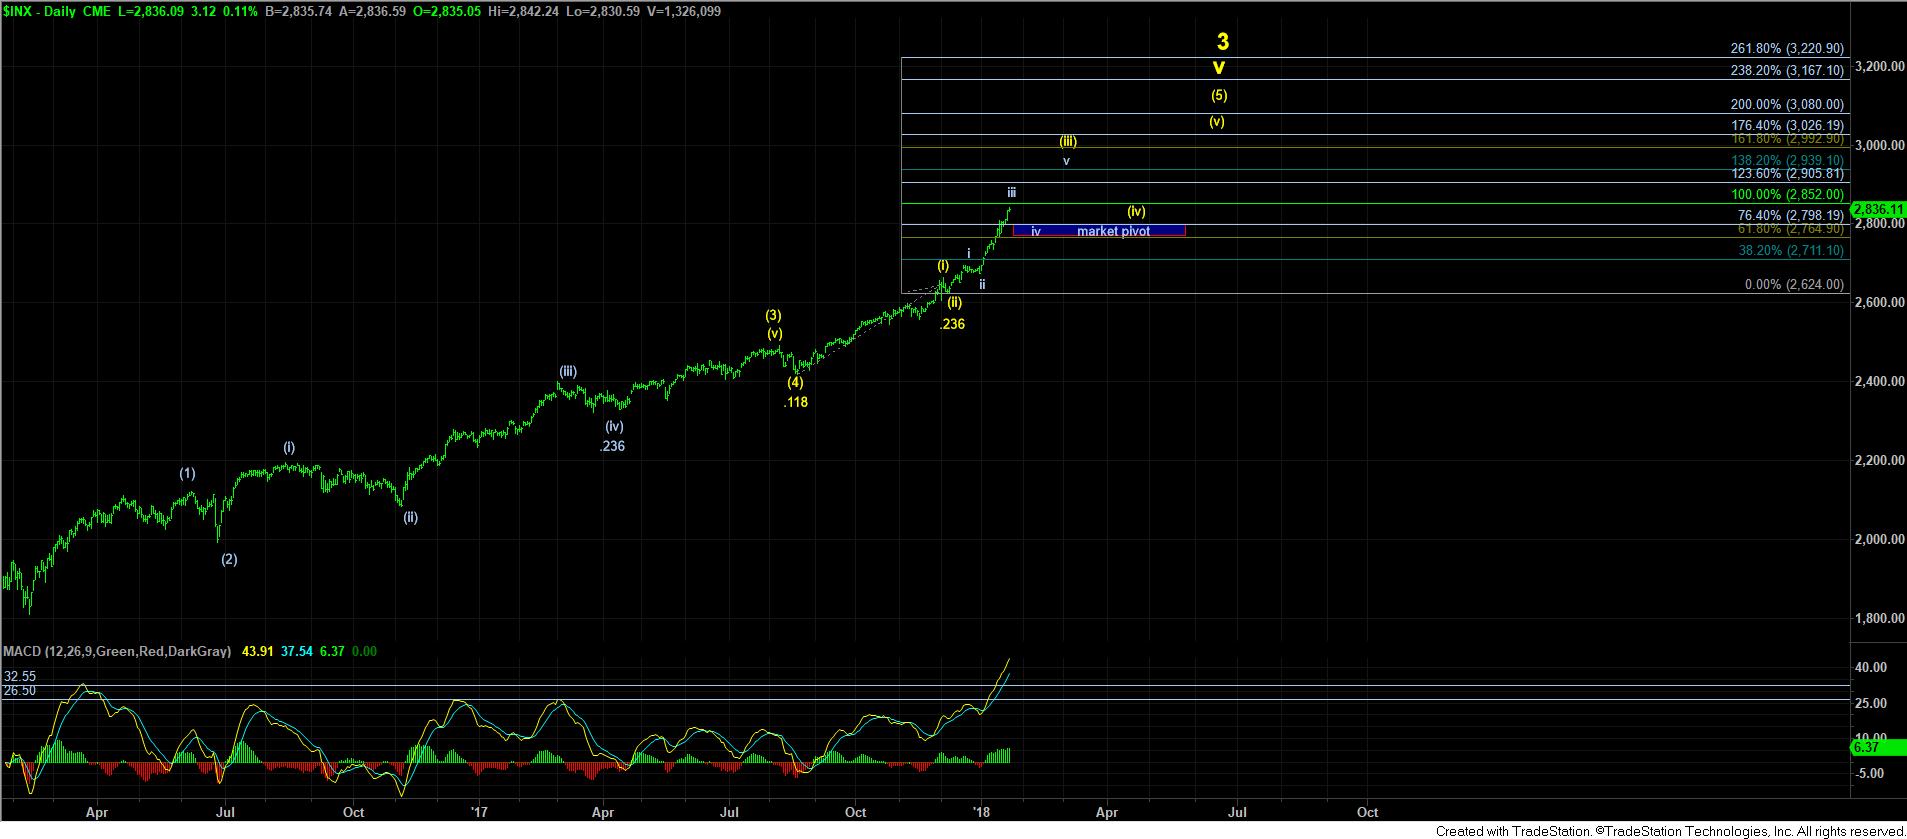
So, let’s take a look at the alt-bullish chart, which is the only chart I am providing this evening for simplicity purposes. As you can see, this wave structure supposes that the rally which began in late August would be within yellow wave (iii) off that low.
Now, wave iii of (iii) targets the region between the 1.00 and 1.236 extensions of waves (i) and (ii) as a wave iii of (iii) target. That region begins at the 2850SPX region wherein the 1.00 extension resides. Once this wave iii of (iii) completes, we then pullback to test support between the .618-.764 extension. That region has been noted on the chart as the “market pivot.” If we pullback and hold that support region between 2765-2800SPX, and then break back out over the high we strike for wave iii of (iii), it would suggest we are on our way next to the 2939-2993SPX region to complete wave v of (iii) on this chart, and after a wave (iv) back towards the 2850SPX region, would point us to just over the 3000 region to complete this structure which began in late August 2017.
However, if the market is able to break below the 2765SPX region in the coming week or two, then it makes the potential for a direct move to 3000 much less likely in my humble opinion. Rather, we can still see a pullback towards the 2685-2745SPX region for wave 4 in my primary count, with one more rally still to be seen before a larger degree correction takes hold. Moreover, it would take a sustained break of 2685SPX to suggest that a larger degree correction is in progress from this region.
So, while we continue to respect this bull market, which still likely has several more years to run, we are a point where the market is going to give us a much clearer indication as to whether we take a more direct route to 3000 or not.
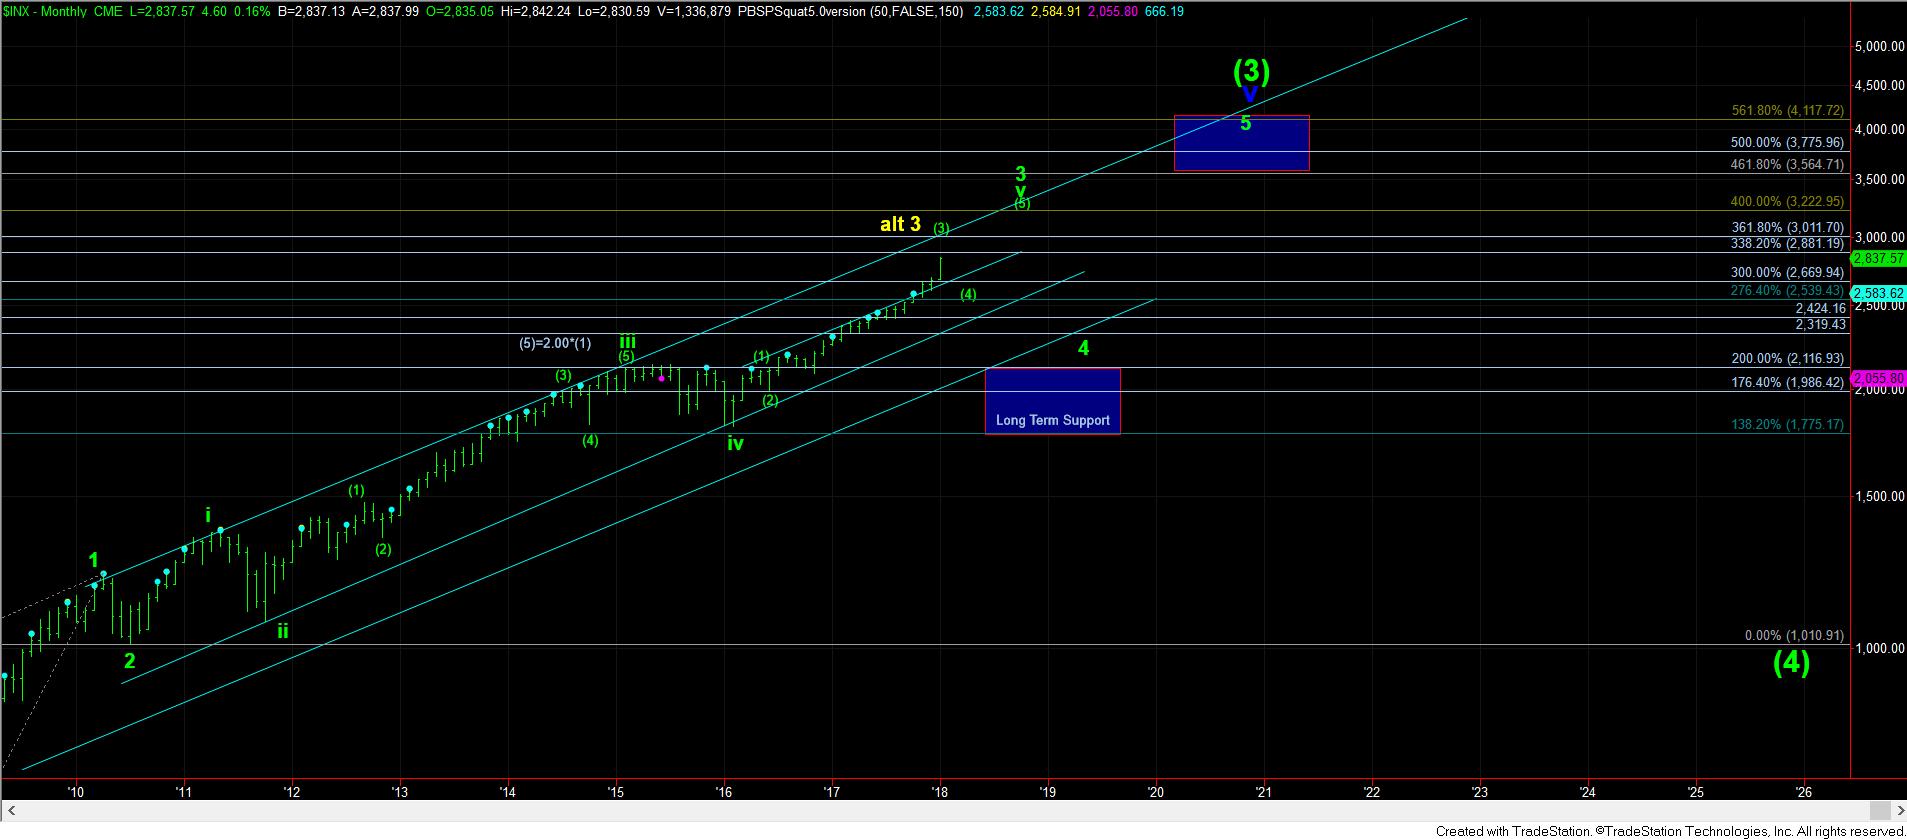
And, lastly, I want to note that I have slightly modified the monthly SPX chart to move my potential target for the top of this bull market in the early 2020’s to the 3500-4100SPX region, for now. Once we begin wave 5 of v of (3) on that monthly chart, we should be able to narrow that target down significantly.