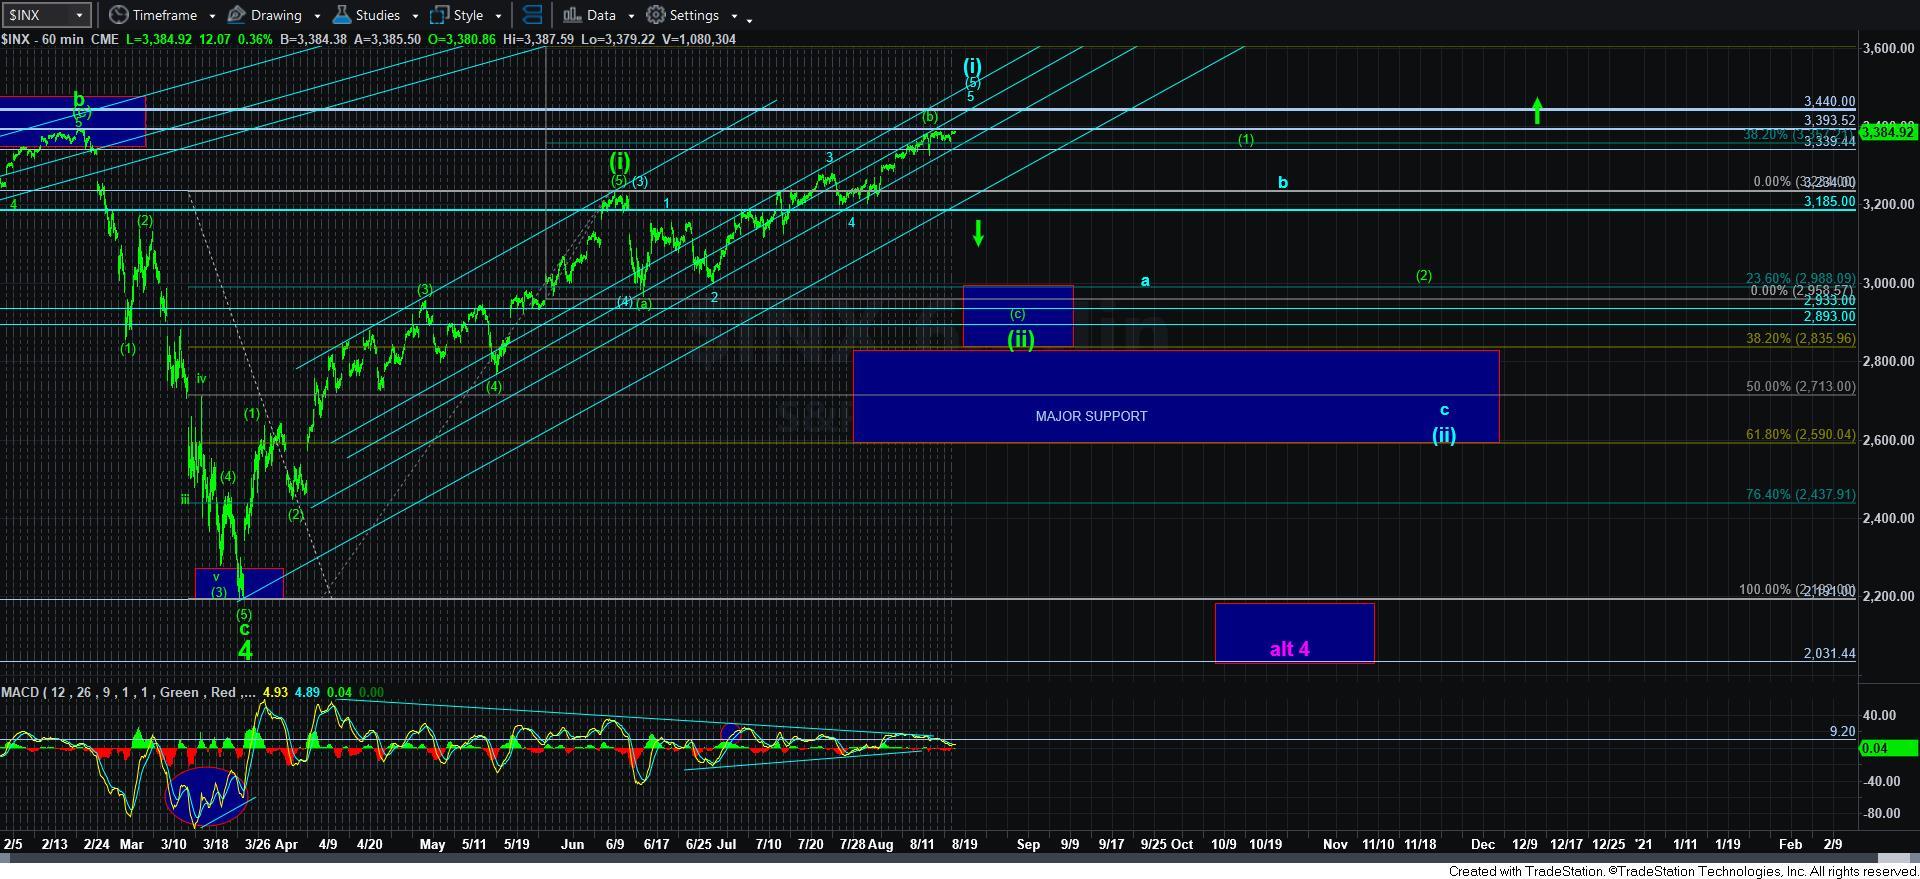
Time To Re-Assess The Micro Structure On SPX
With the market being unwilling to provide us with much of a pullback over the last week, and clearly not breaking any support, I have to re-assess my micro perspective on the SPX.
Up until now, I was assuming this was a very extended wave 3 within wave [5] in the blue count. However, with as high as we have now come, I have to now assume that we are actually within wave 5 of [5], as I am now showing on my 60-minute chart. This will get confirmed if the market can exceed the all-time high in the 3393SPX region this week.
Should we break out over 3393SPX, then I will assume we are heading to the next major Fib level in the 3440SPX region to complete wave 5 of [5] of wave [i] off the March lows. Again, please remember that if we are only completing wave [i] at this time, then we will likely be moving into a multi-month wave [ii] pullback, as outlined in blue on the 60-minute chart. Moreover, this pushes out the start of wave [iii] likely until after the election. In fact, it would likely suggest that wave [1] of [iii] will take shape as our “Santa-Rally” this year.
So, unless the market begins to break below support before we break out to a new all-time high, then I have to assume we are actually one micro wave degree higher than I had initially thought. And, it would seem that a break out over 3393SPX would ideally take us to the next major Fib level on all time frames within the 3440SPX region, which “should” complete all of wave [5] of [i].
Lastly, should we break out towards the 3440SPX region this week, I will make the blue count the new green count, and I will add another bullish alternative onto the chart as a blue count. For now, I still expect a bigger pullback towards at least the 2900 region before we are ready for wave [iii] to take hold in earnest.


