Time To Prove Itself
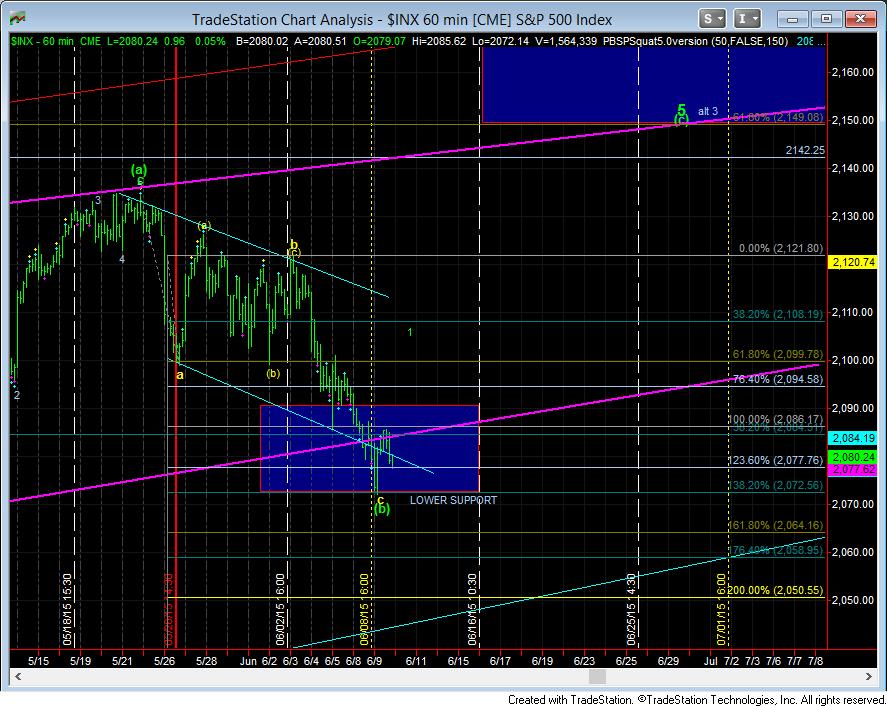
With the drop down to the 2072SPX zone, the market has now pushed this count almost as far as I am willing to accept. It’s time for it to now prove itself in the SPX, or we can see it drop down to as low as the 2040-2055SPX zone next.
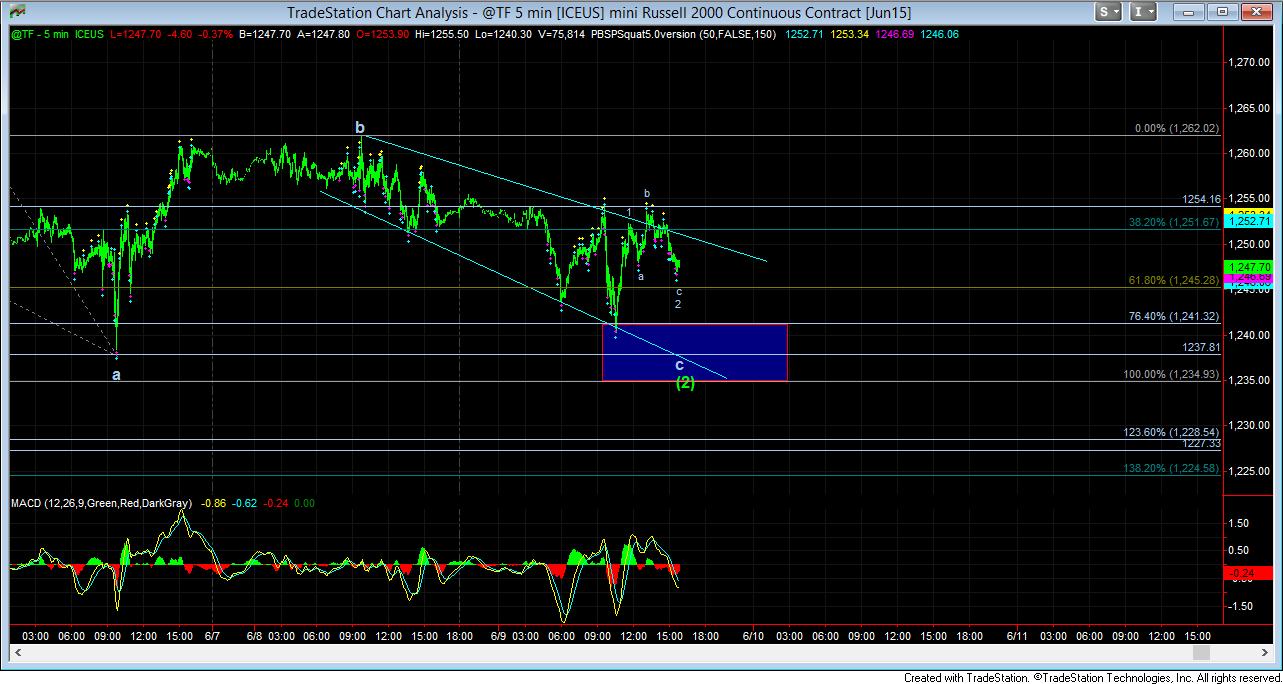
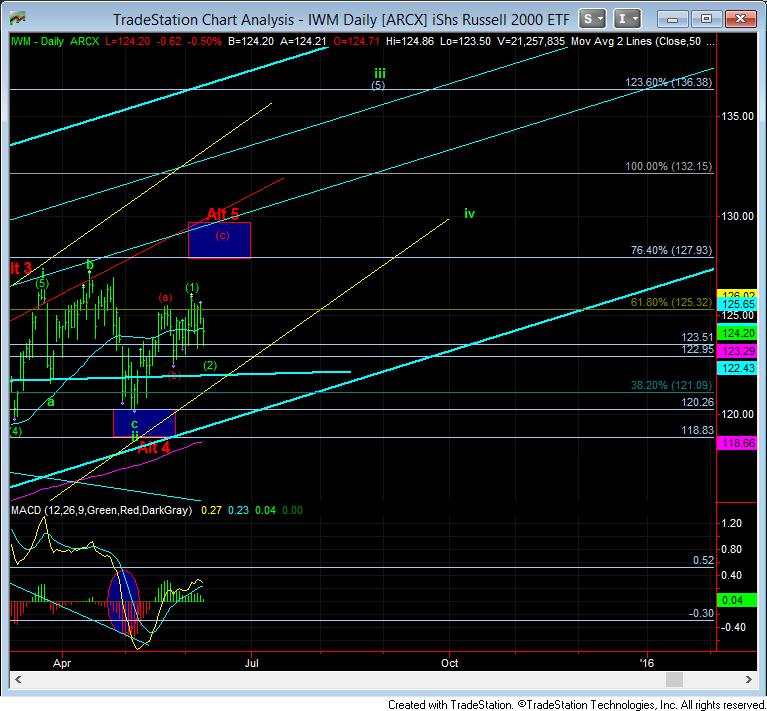
However, what is keeping me quite bullish still is the IWM chart. Thus far, we have been tracing out an a-b-c pattern in a wave (2). In the attached TF chart, you will see that the ideal target was the 1235-1238TF region. However, the market may have signaled a shorted bottom at the .764 extension it struck today, when it seems to have developed 5 waves off the low. And, as noted earlier, a strong break out over the 1255TF region should set us up for new market highs.
At this point in time, if the SPX is truly going to get in gear to be striking the 2154SPX region next, it will need to prove this tomorrow with a gap up towards the 2100 region for wave 1 of (c) of 5. If we are not able to muster that type of move overnight, then the next lower level which will be tested is the 2064SPX level, and below that opens the door to SPX 2050.
But, ultimately, as long as the TF remains over the 1235 level, all we have is an a-b-c consolidation which will likely send this Russell to new market highs, and the question will then become how much of a rally can be sustained in the SPX, and if it will be able to attain new highs as well. So, for me, tomorrow is quite important for the SPX, while the TF/IWM still has room below before we rule out higher highs to come.