Time To Be Cautious And Let The Market Prove Itself
I wanted to send out an update at this time because of the critical point I am seeing us as being in the market.
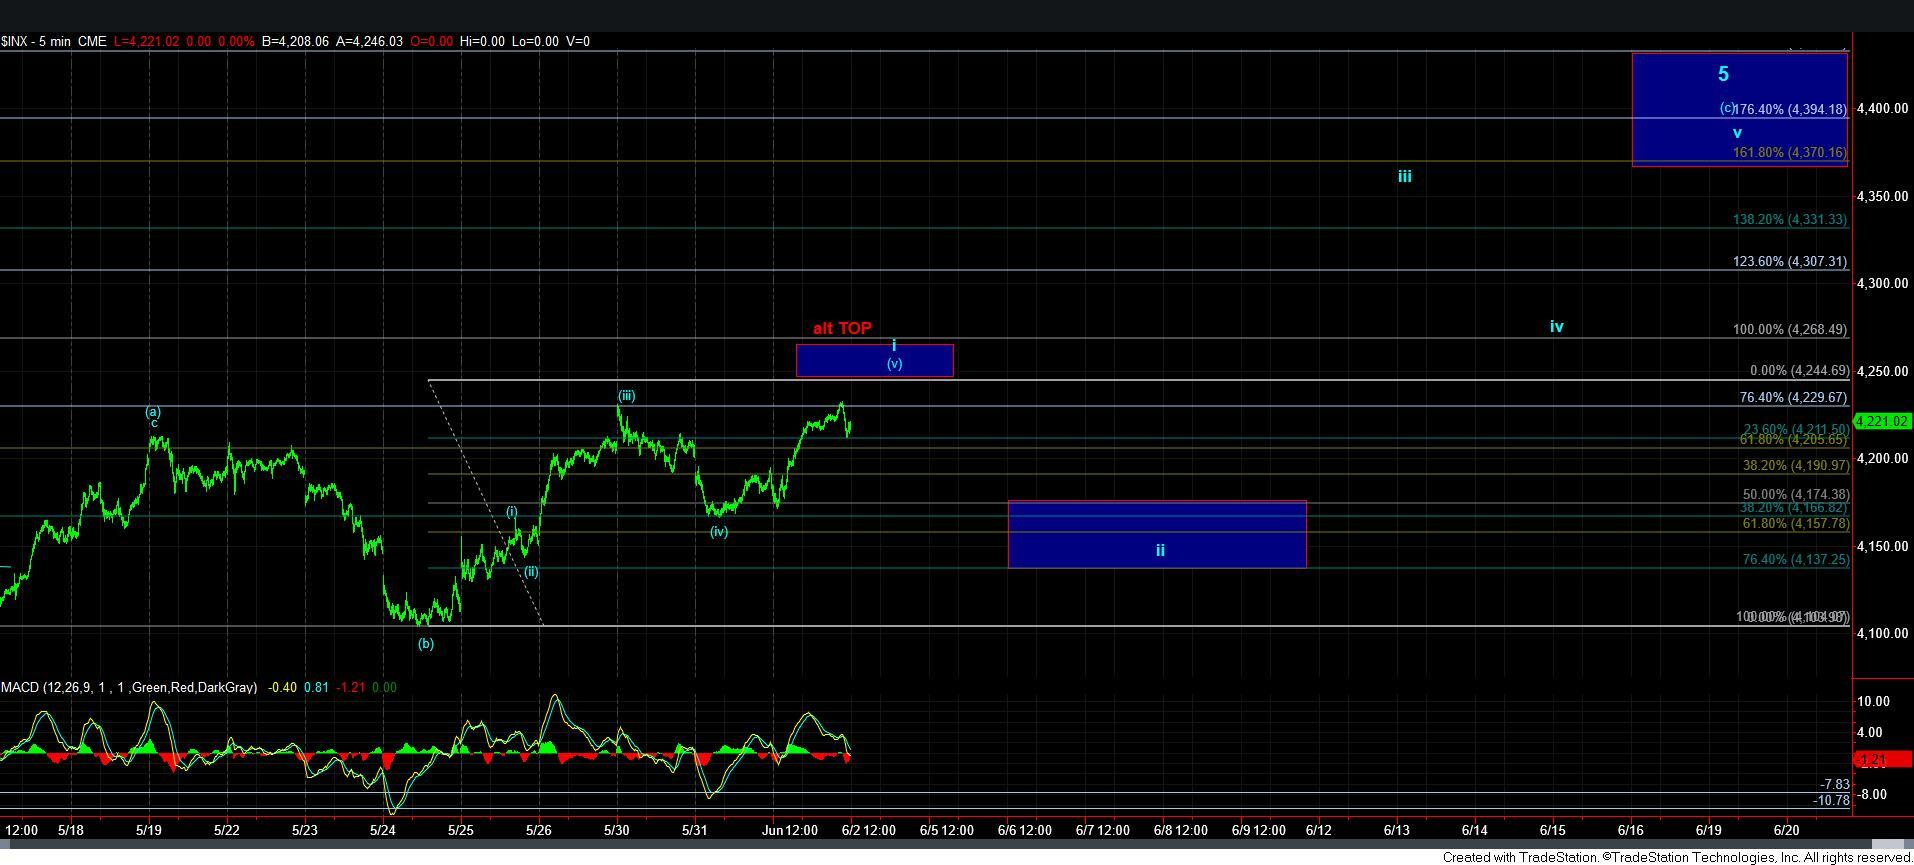
The main reason I am sending this out is because we now have a potential 5 waves up from the low struck on May 31st. That could mean we have a completed a-b-c rally, and it can be all of the rally we get to complete the larger degree b-wave. We now have the minimum number of waves in place to consider it complete.
While I have this potential only as an alternative, as presented in red on the 5-minute SPX chart, and I still think we will extend higher, I am compelled to at least bring that potential to your attention. And, should we break down below 4130SPX, then we have an initial signal that the b-wave top is in place, with follow through below 4104SPX making it much more likely.
So, in my primary count, which still suggests we can see higher, the next pullback will be the key as to how high we can go. I have outlined two potential paths that can take us there. The first is presented on the 5-minute SPX chart. The current higher highs we are seeing in the futures - if projected on the SPX chart - would complete a 5-wave structure for a larger wave i off the 4104SPX low. While I noted above that it MAY be completing all of the b-wave rally off the October low, this count presented on the 5-minute SPX chart suggests it is only wave i of the [c] wave rally in the smaller degree.
I have added a support box for a wave ii pullback, as you can see. Should the market provide us with a mutli-day pullback that holds over 4130SPX, then this count has potential to take us to 4400SPX, and even a bit higher, depending on how deep wave ii takes us.
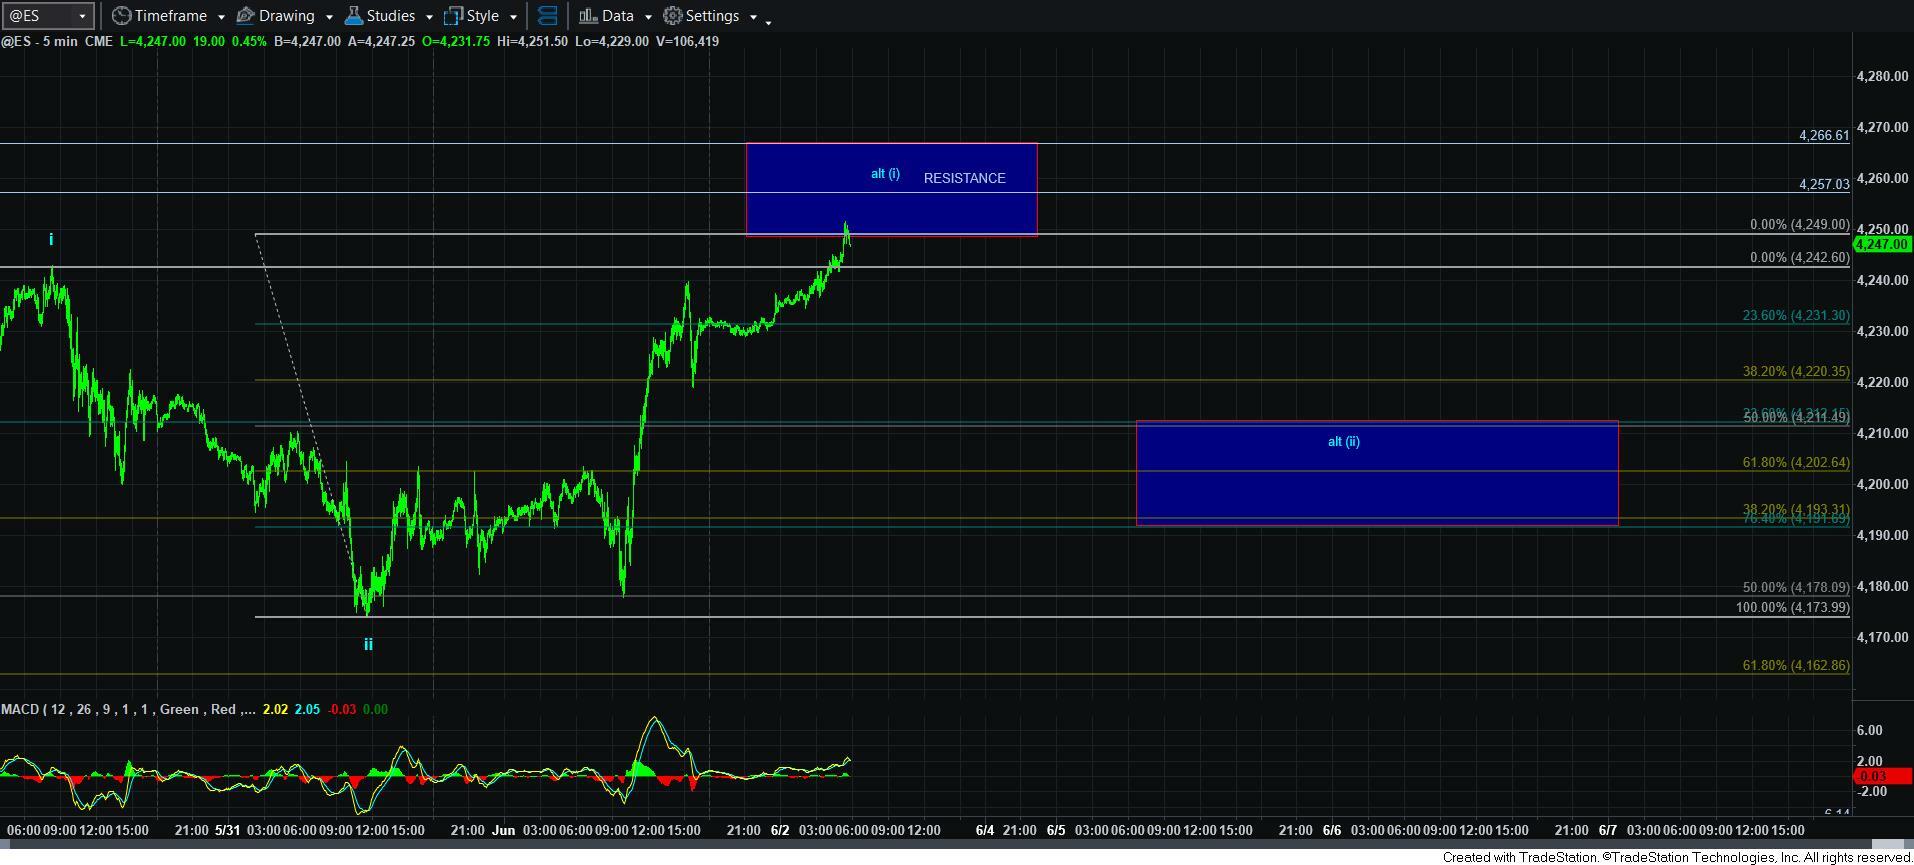
The alternative I am forced to track is that the rally into the high on May 30th was actually a leading diagonal for wave i, and the high we are now striking is a wave [i] of iii in that structure. This is presented on the 5-minute ES chart. This would take us to the 4350-4400SPX region, depending upon how deep the next pullback takes us.
So, in effect, what I am saying is that I think it is time to be cautious, and I think we will "likely" see a pullback into next week, as long as the resistance noted on the 5-minute SPX chart is respected. And, as long as we hold over 4130SPX on the next pullback, I am still looking for a rally to take us over 4300SPX, with the nature of the next pullback likely telling us how far through 4300SPX we can rally.
What I will be looking for to clear up how high we can actually rally is where we find support. Based upon where the market finds support in the coming week, and then takes out the high we strike up here will set the wave count for this rally. But, again, a failure to hold 4130SPX is a big warning to the long side.