Time For The Market To Make A Decision
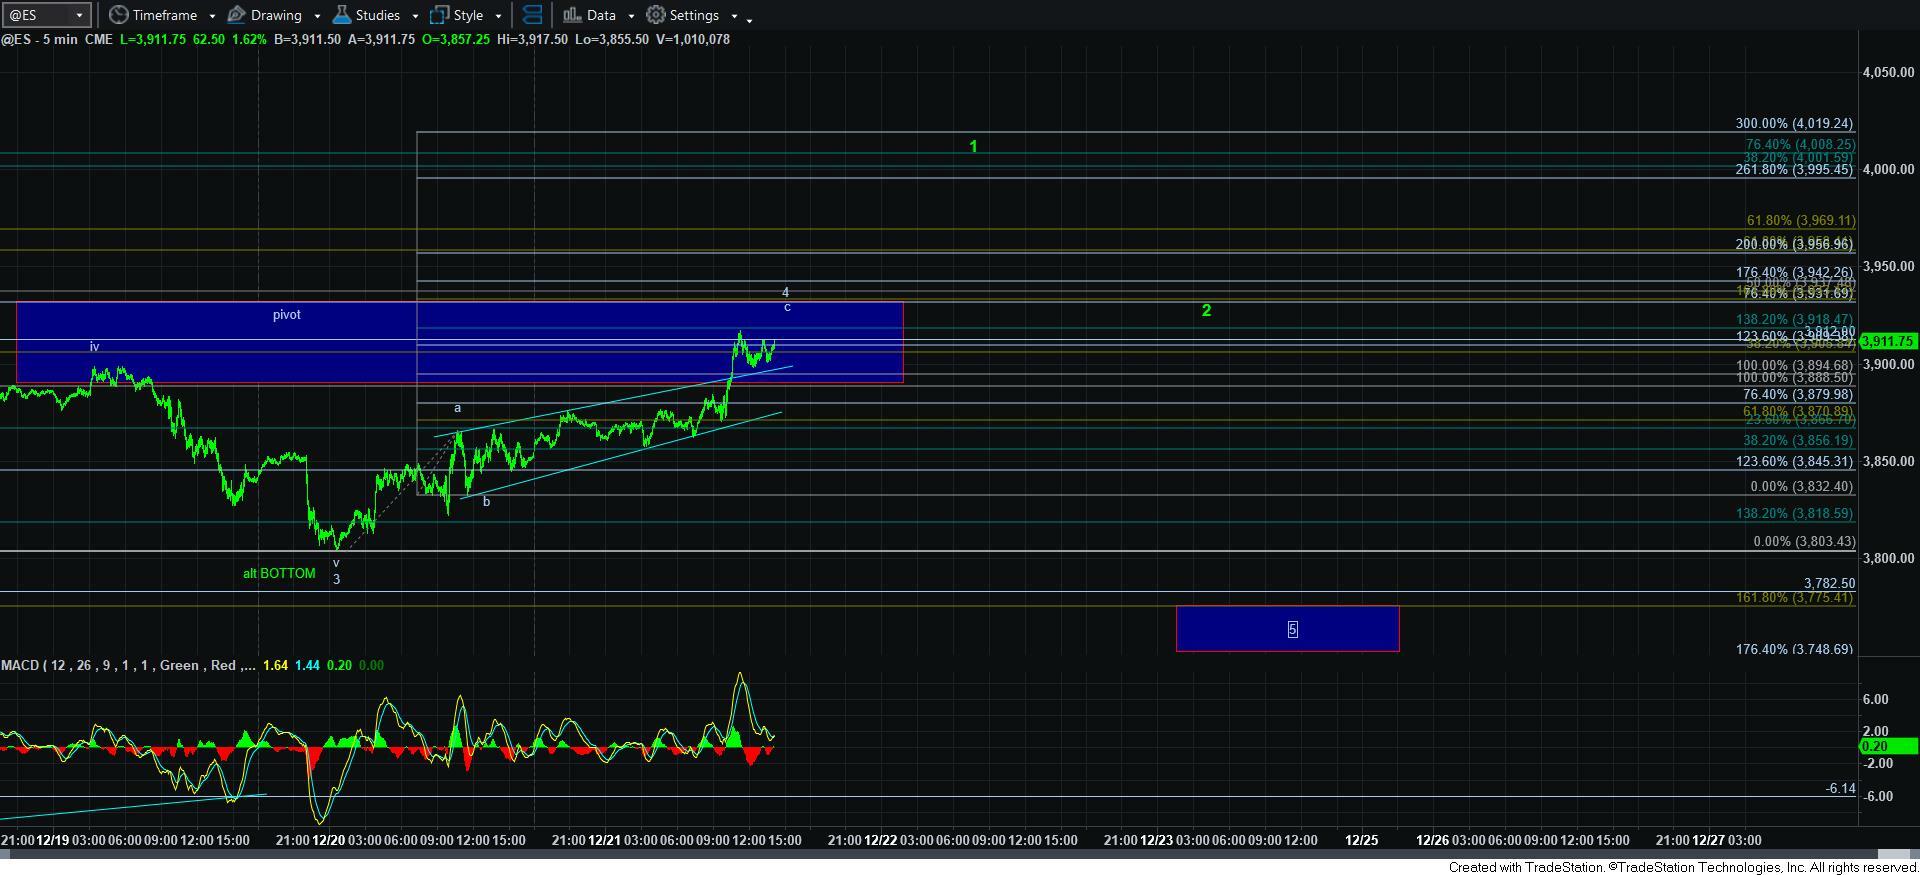
Well, as we expected, we have now visited our market pivot on the 5-minute ES chart. And, as I have been outlining, the market will either top in the pivot for a wave 4, and then decline in wave 5, or we will blow through the pivot, and strongly suggest that a bottom has indeed been struck.
And, for now, I still retain the primary count of a 5th wave lower low, and it is supported quite well by the EEM chart too. But, needless to say, if we see a break out through the pivot, I will not argue with the market.
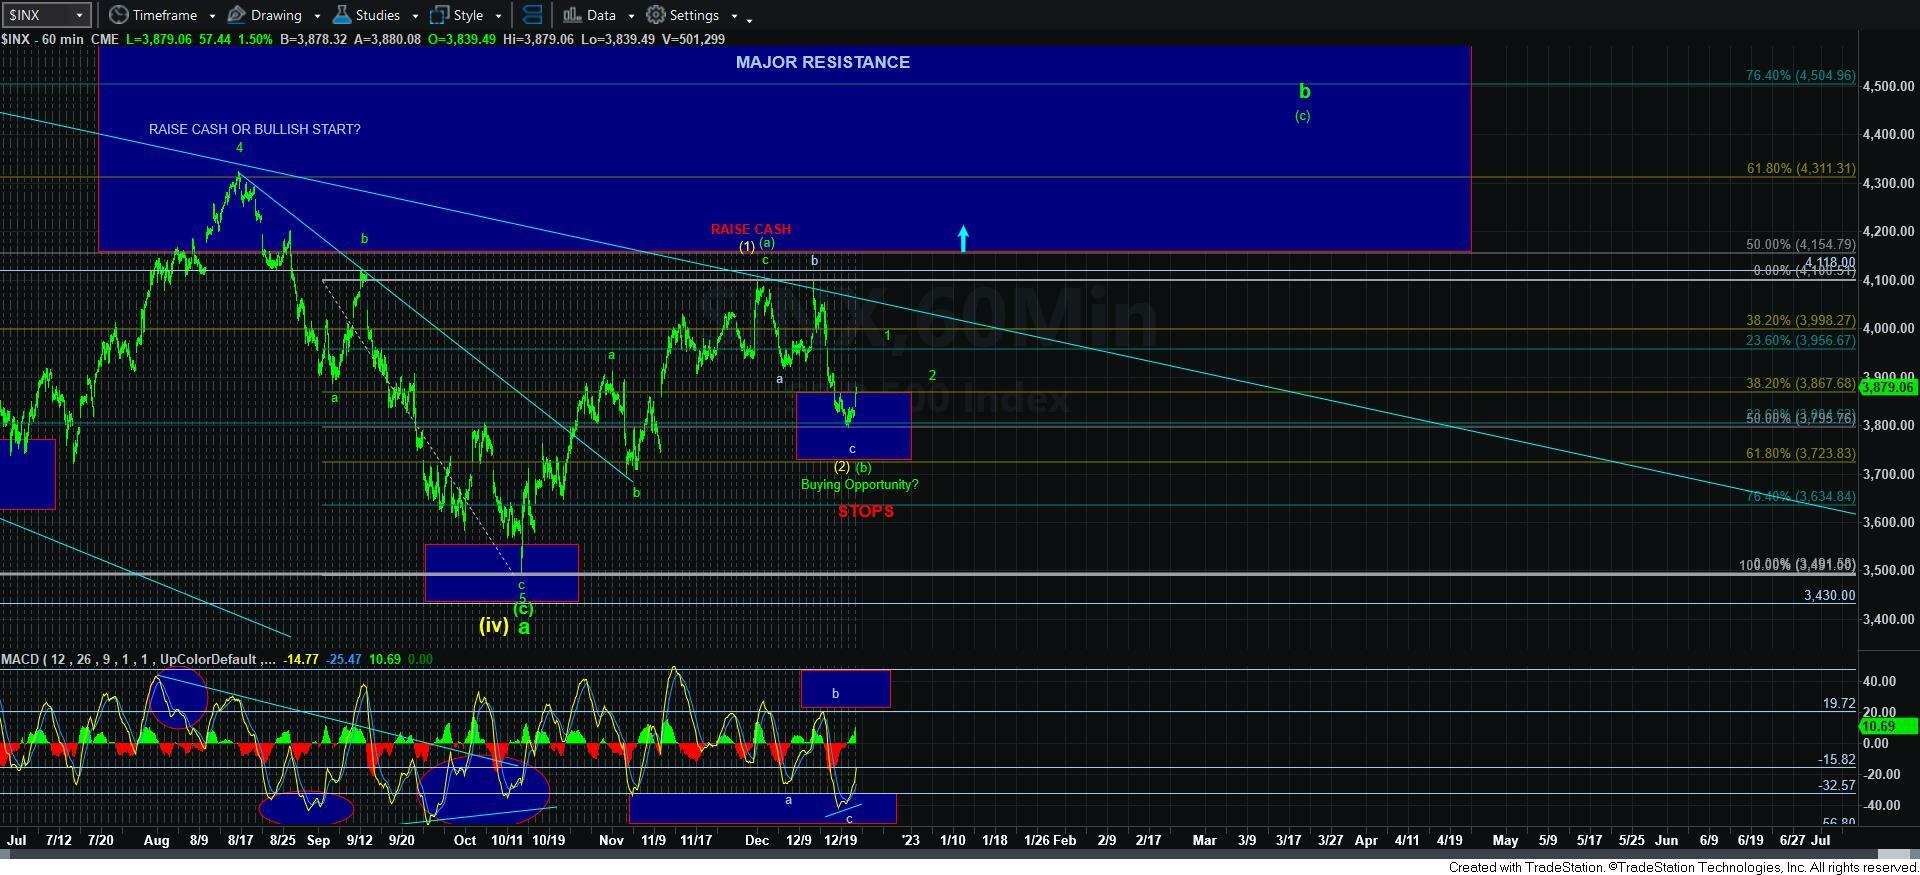
The next phase of the market move higher may become a bit more complex, and I discussed it today in the live video opened to all full members. Basically, if we see a 5-wave rally off the lows for wave 1, then it strengthens our perspective that we are rallying in the [c] wave of a larger b-wave, with a minimum target of 4300SPX (but can easily extend to 4500SPX, depending upon the size of the 3rd wave in the [c] wave).
However, if the market rallies in a corrective structure, and then breaks out over the recent highs in such a manner, it would bolster the yellow count, as that represents an ending diagonal to new all-time highs. Remember, diagonals take shape as 3-wave structures, whereas [c] waves are most often a 5-wave structure. Therein lies the difference between the two potential rally structures I will be tracking into 2023, assuming our support below us continues to hold.
But, for now, we are at resistance, and the market can even see one more micro push higher before the wave 4 “bounce” completes. And, again, should we see a strong move through the pivot on the 5-minute ES chart, then I have to assume the bottom is in, as I have been outlining over the last few days.