Time For A Decision
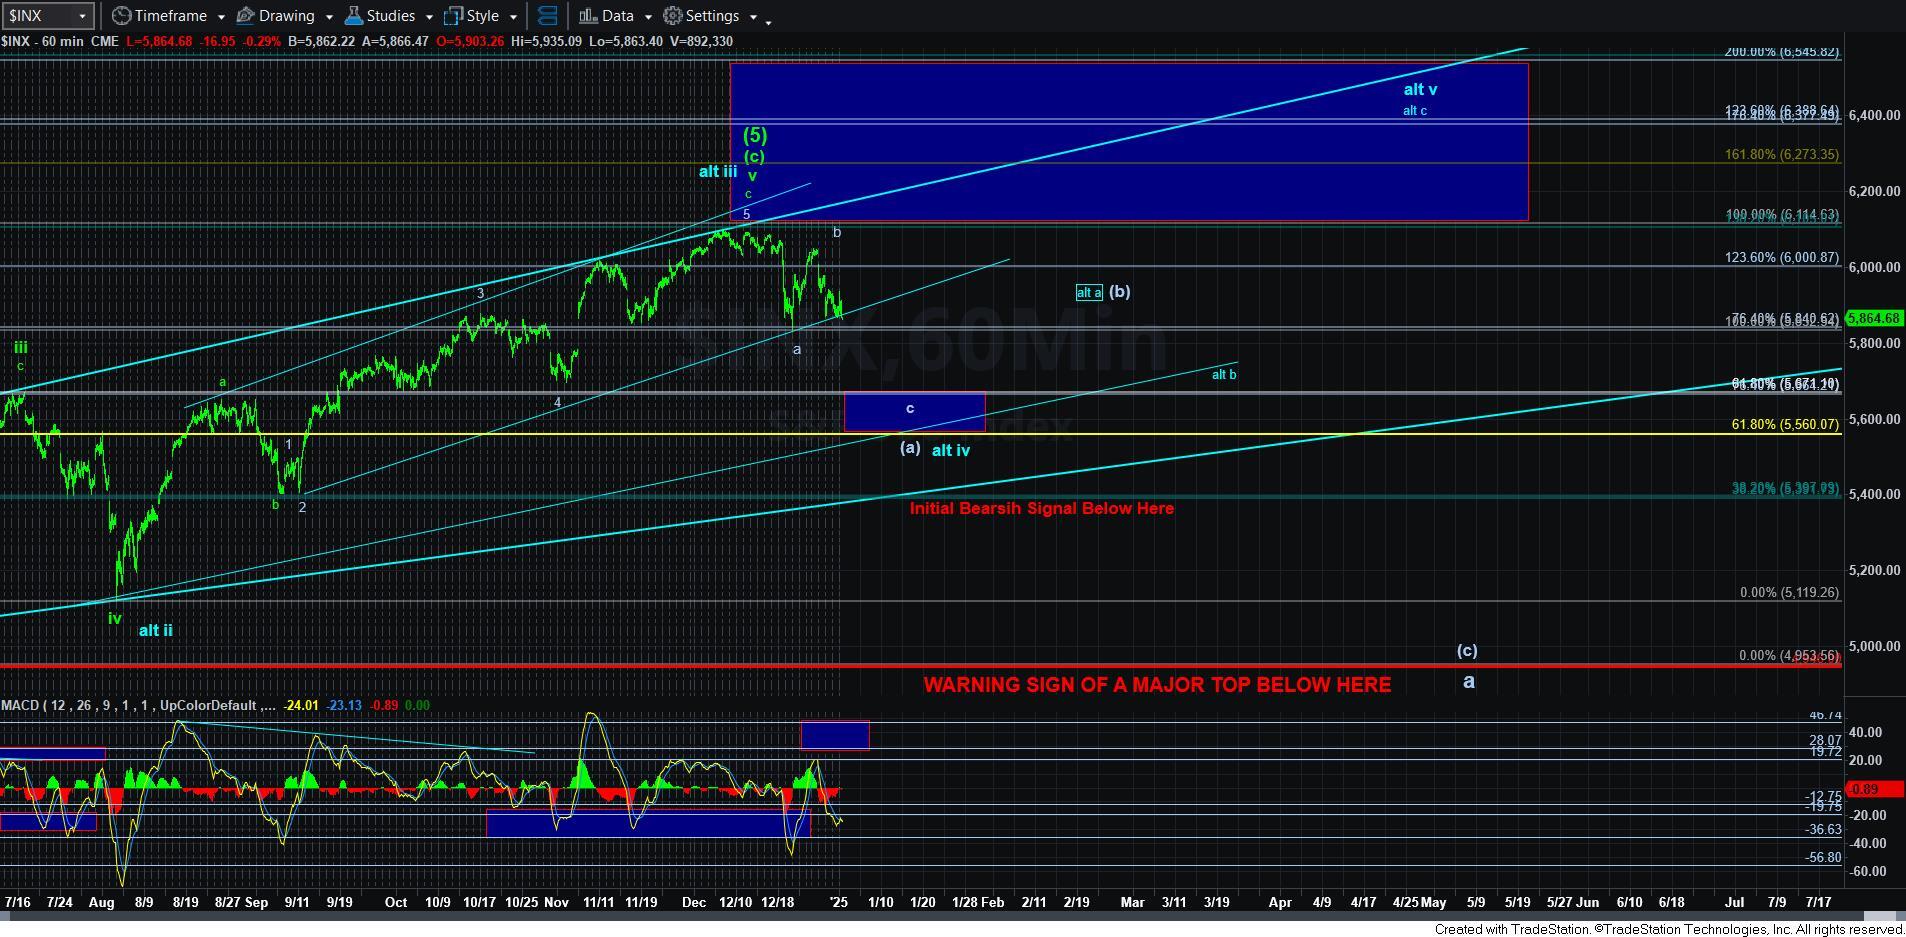
The market has been quite weak these last several weeks. And, while my expectation remains for it to be likely that we will test the c-wave support box below, the path has been open to question.
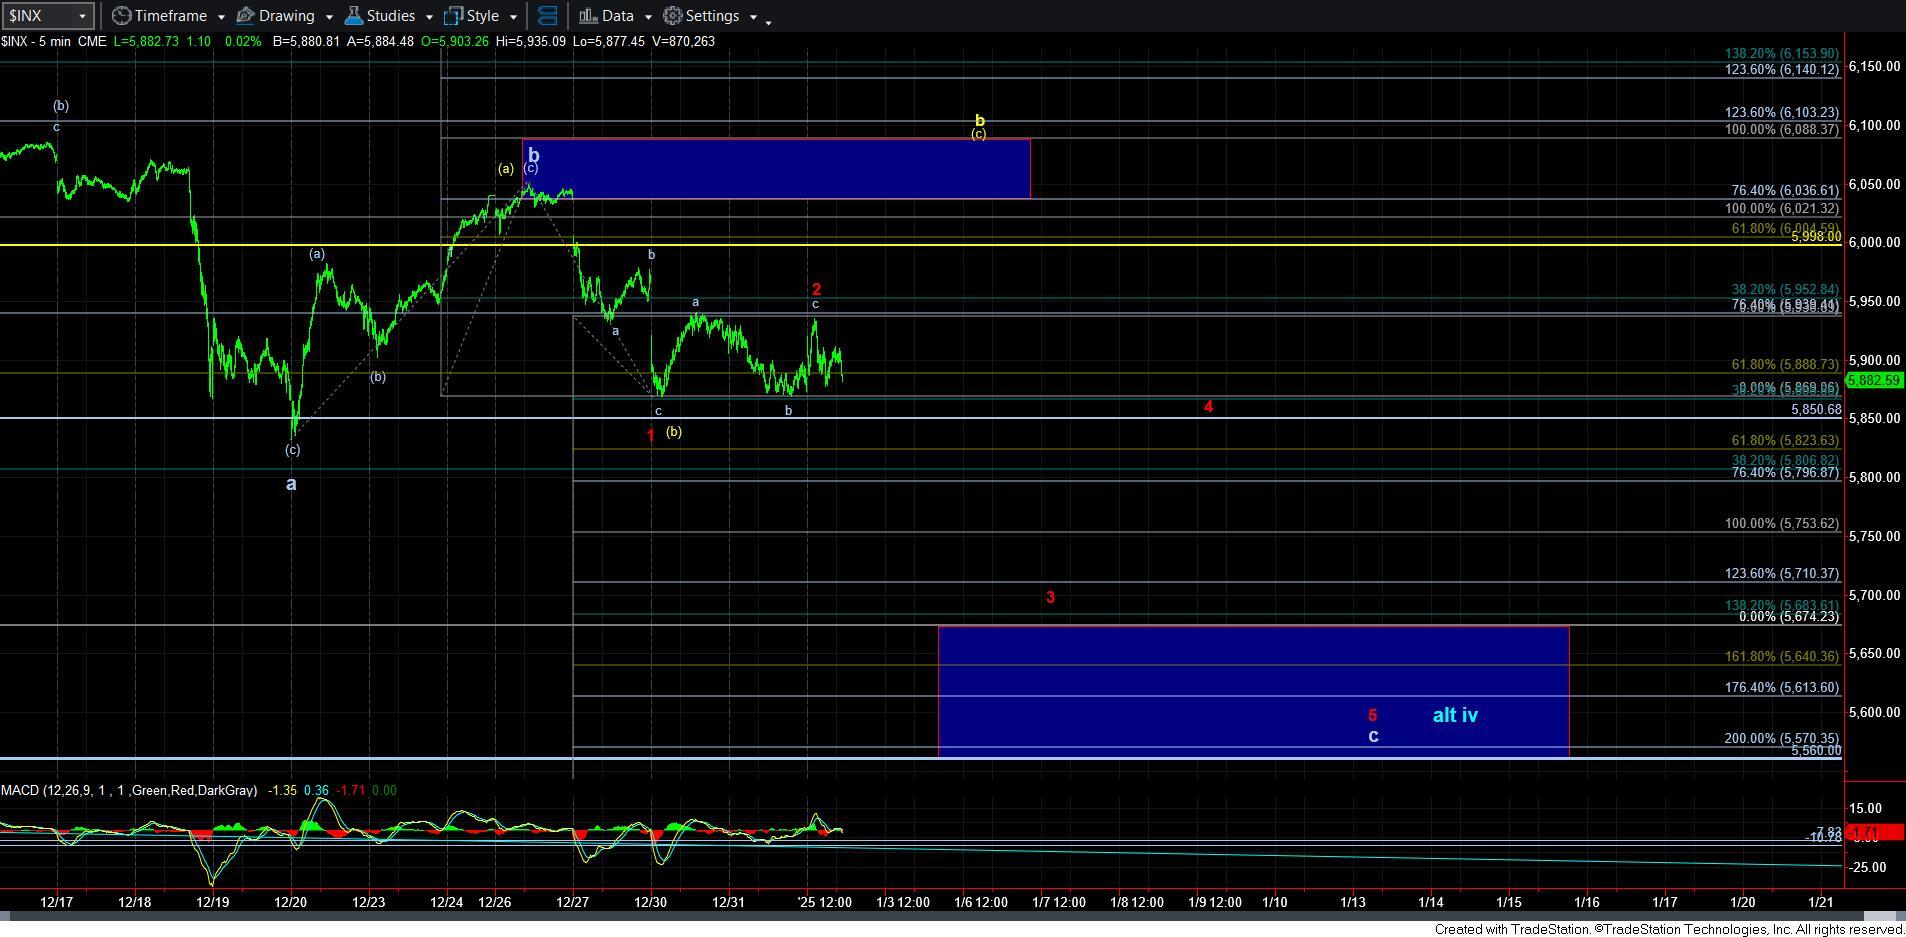
Normally, a c-wave is a standard 5-wave Fibonacci Pinball structure. However, since the market dropped in what seems to be an a-b-c decline off the high struck last week, the most reasonable way to count an immediately expected c-wave is as an ending diagonal.
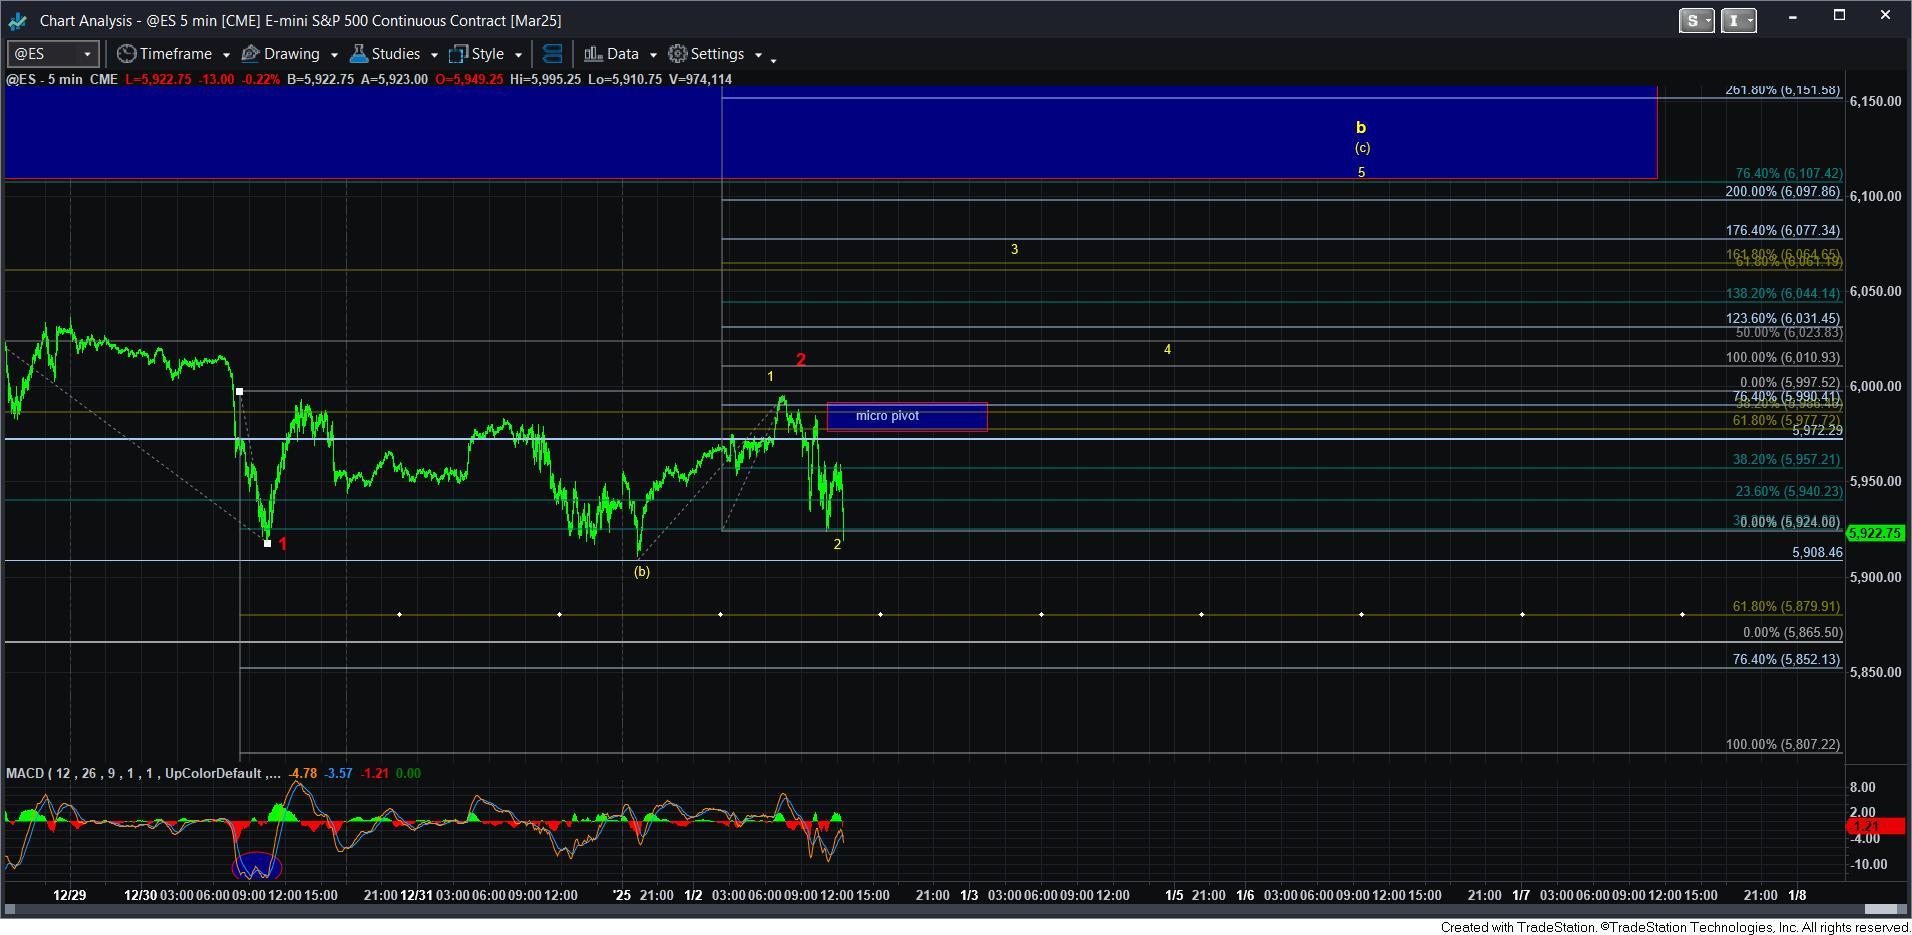
Within that ending diagonal structure, we have completed an a-b-c for wave 1, as labeled on the 5-minute SPX chart. Moreover, it would suggest we have completed an a-b-c for wave 2 this morning. Therefore, should the market begin to break down below the ES overnight low in a sustained fashion, then I am viewing this path as the most likely one, and targeting the 5700SPX region for wave 3 in the ending diagonal, as the 1.236-1.382 extensions are the general target for wave 3 in an ending diagonal.
The alternative path we have been tracking is in yellow, which suggests more of a complex b-wave structure. As I am writing this update, the market is having hard time holding onto that potential path.
So, again, if we see a sustained break below the overnight ES low, that opens the door to the red count in a more direct path to our c-wave target below.
And, may I remind you, if we do complete 5-waves down into our c-wave box, then I would consider adding long positions for a potential run to new highs. However, we will not be able to confirm that is the case until we see the pullback from the a/[b] noted on the right side of the 60-minute chart.