Time For A Bigger Picture Update
With the market thrashing around, it has been telling us that we are likely still well within a larger degree corrective structure. And, from my perspective, it suggests that we are still well within the larger degree wave [ii] pullback that we have been tracking on the 60-minute SPX chart.
Yesterday, the market provided us with an important clue as to where we stand within the context of the current market structure. As I have outlined in many prior updates, when we broke below the .618 extension off the September low, it increased the probability that we are still within the green wave [ii] pullback, and it significantly decreased the probability that we are in the more advanced yellow count pointing to 4000 sooner rather than later.
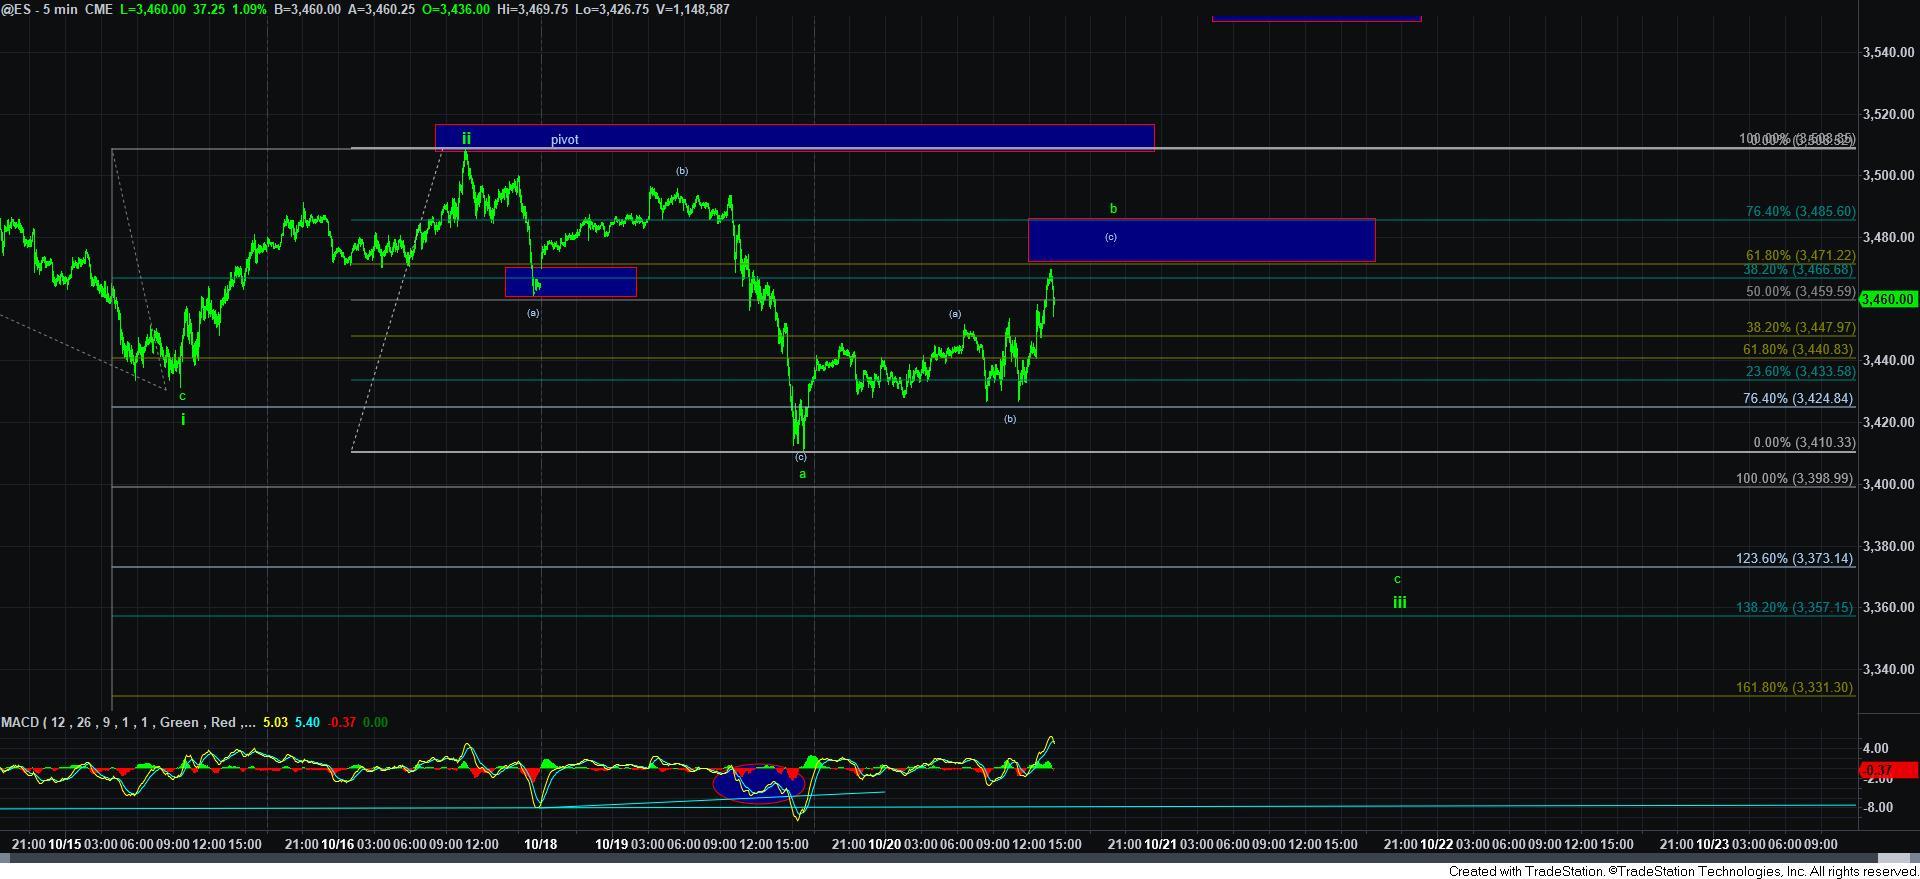
Now, normally, when we begin a c-wave decline, the market initiates that decline with a 5-wave structure to complete wave 1 of the c-wave decline. Unfortunately, in our case, the market has not made it that easy. Rather, the decline off the high struck last week is overlapping in nature, and taking shape as a series of 3-wave structures. That either means that wave 1 of the c-wave down is taking shape as a leading diagonal, or it means that we could still see another push to a marginally higher high before this b-wave actually completes.
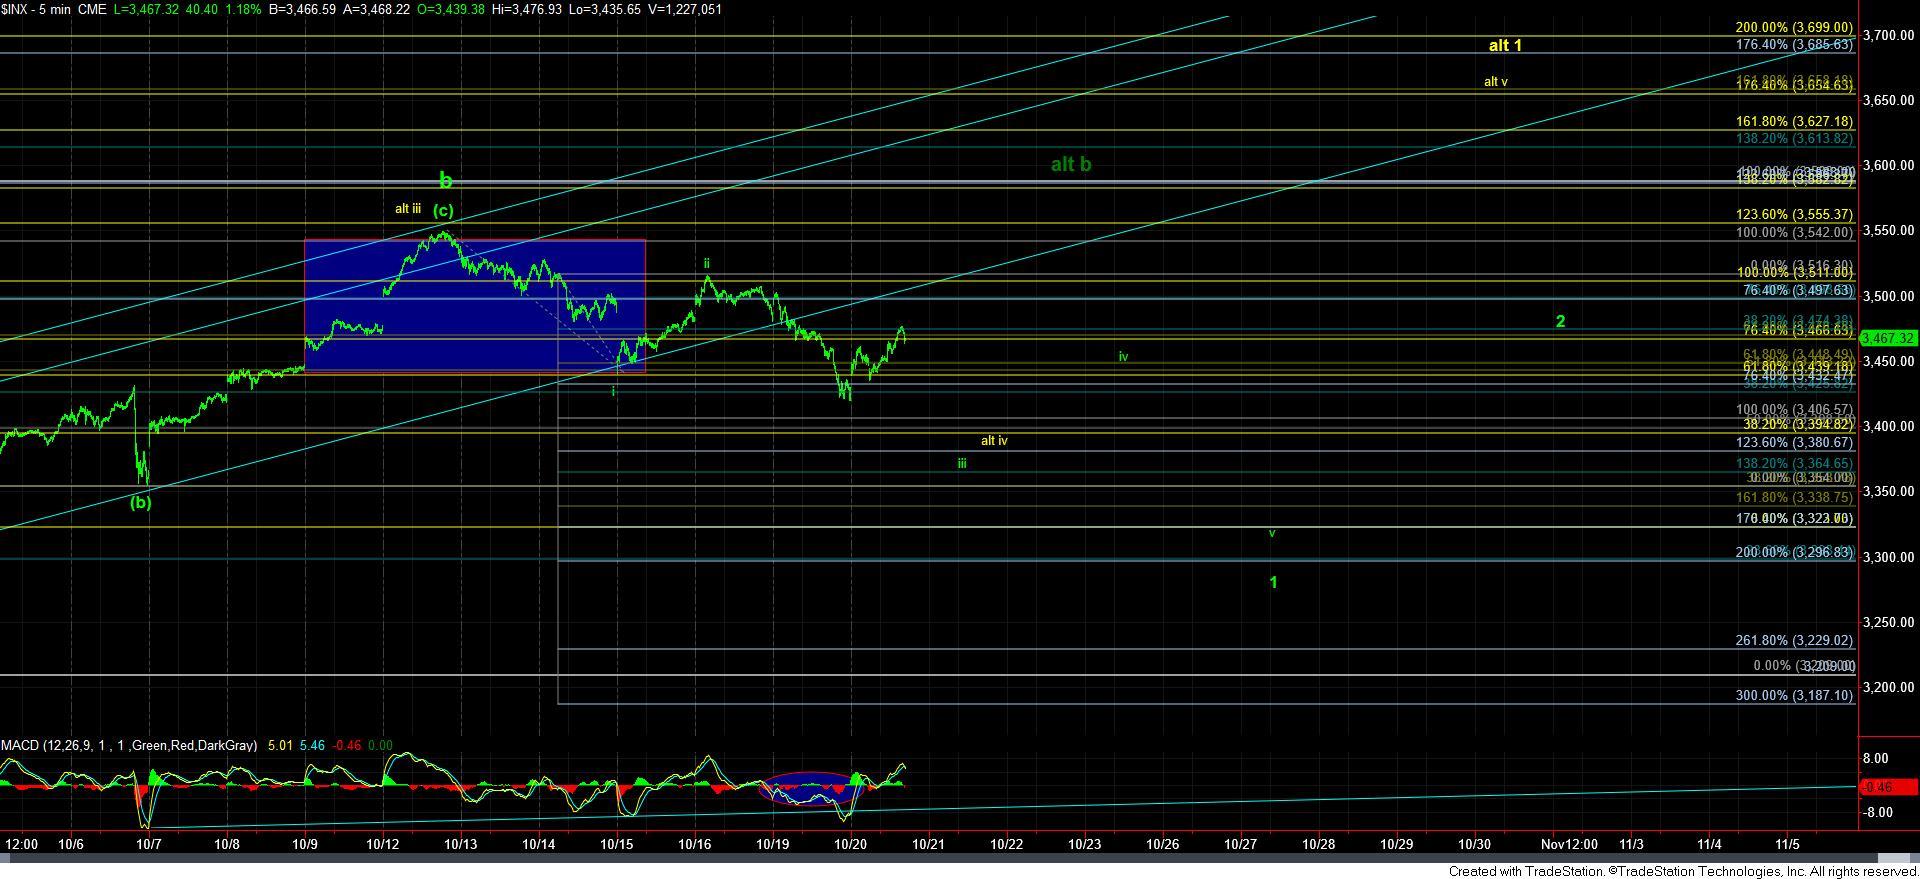
So, for now, I am tracking the potential for the leading diagonal down to complete wave 1. That means that as long as we respect the 3470-85ES resistance, I am looking for us to continue down to the 3370ES region to complete wave iii in the leading diagonal for wave 1. Should we be able to move through that resistance, then it does raise the probabilities that the b-wave has not yet completed.
Overall, I think you should recognize that the action will likely be quite overlapping in the coming weeks as the market sets up the 1-2 downside structure for the c-wave decline. And, for most of you, this is not an environment that will provide you with many high probability smaller trades. Whipsaw will continue to be the name of the game, as the market sets up the 3rd wave decline in the c-wave of wave [ii].
That being the case, now is a very good time to continue working on your shopping list. As an example, I still have some of my 2nd tranche stocks which have not hit their targets, and almost none of my 3rd tranche stocks have really hit their ideal pullback targets. So, now is the time for you to update your shopping list, and the StockWaves analysts have done an exceptional job in continuing to track their SW300 focus list for the upcoming 3rd wave I expect as we look towards 2021.
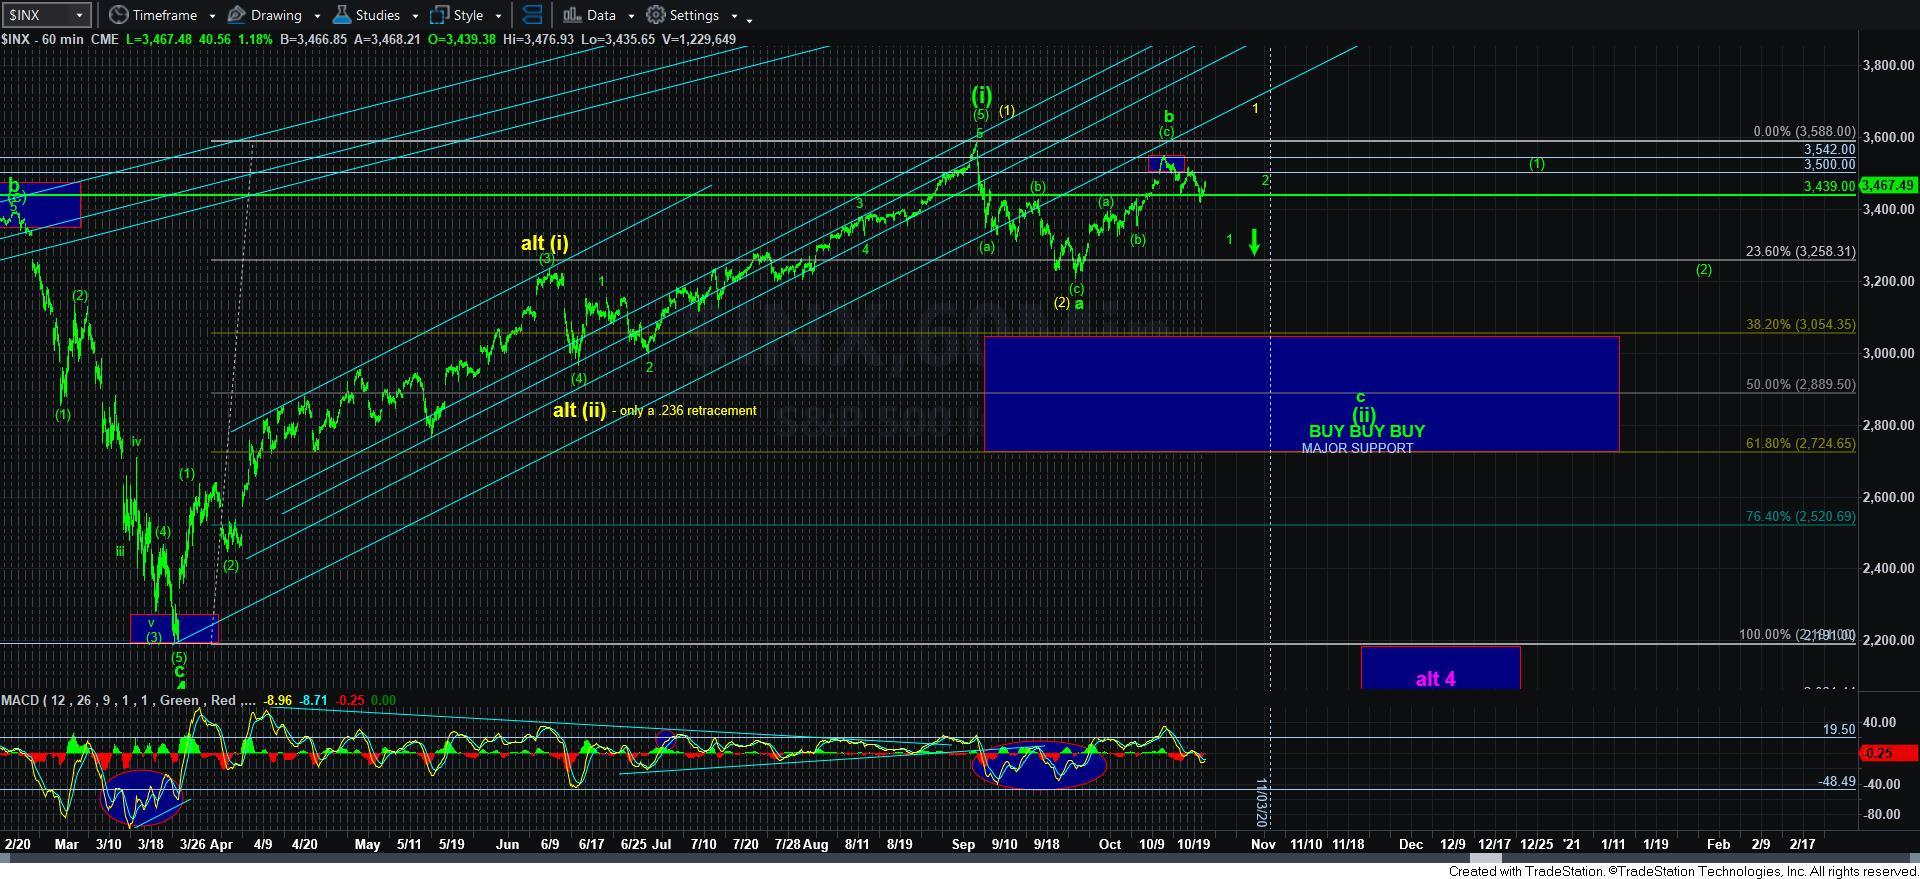
Please take a step back and look at the 60-minute chart. As you know from reading my analysis, my ideal target for region for the c-wave of wave [ii] is in the 2900-3050SPX region. But, support does go all the way down to the 2700SPX region, which can be struck with a VERY strong 3rd wave decline within the c-wave.
So, my own personal plan will be that I will be buying the individual stocks remaining on my list as they approach their targets during the 3rd wave of the c-wave decline. However, for me to be interested in index positions, I would need to see the market complete wave 3 of the c-wave, and provide us with a CLEAR 4th wave bounce, at which time it will develop the positive divergence set up I like to see as a c-wave is approaching completion. That 4th wave bounce within the c-wave tells me it is time to prepare for a final bottoming spike in the market before we begin wave [1] of wave [iii], which is outlined on the right side of the 60-minute chart.
However, if your interest is in buying option positions for the 3rd wave, I want to caution you. The best time to buy options – at least in my humble opinion – is AFTER we complete waves [1] and [2] within wave [iii], and then break back out over the high of wave [1]. Until then, you are likely fighting the volatility crush we normally see when the market moves off a significant low. Playing the long side of the market using options is often most profitable during the heart of the 3rd wave, which means wave [3] of [iii]. While you can certainly confer with Leo regarding any options strategy you may have (and I strongly urge that you do, as the man is simply brilliant and one of the best options traders I have ever met), I did want to at least provide some of my experience regarding when to aggressively trade the market. And, again, the most profitable time to aggressively trade the market is during the wave [3] of [iii], only to be followed by the wave [5] of [iii].
In the meantime, I am again going to caution most of our members against trying to trade every squiggle in this environment. I think we will likely continue to chop around until the 1-2 downside structure is in place, which may not happen until we get closer to the election. In fact, it almost seems as though the market wants to set up for a “bad news” event after the election. Clearly, I am not going to tell you what the actual news will be, but it certainly looks like they market may be setting us up for a “bad news” type of scenario as we look into early November, which should be the “excuse” for the 3rd wave down I am expecting within the c-wave of wave [ii].
As I have said many times before, Elliott Wave analysis is the only methodology of which I know that provides you with a rather accurate perspective on market context in a very objective manner. And, thus far, it is pointing us towards more of a pullback before we begin the 3rd wave into 2021. So, please recognize where your “fat pitch,” is so that you do not keep swinging at balls that are thrown outside of the strike zone.