Three Wave Structures Continue To Persist
For those that have been doing this for some time, you would know that the preference is to trade standard 5-wave structures, as they are much more reliable and, hence, easier to trade. Yet, there are times where we are forced to deal with 3-wave structure, even when we are in a [c] wave (which, most commonly, are 5-wave structures). Now is one of those times where we are forced to be tracking and trading a 3-wave structure into the target region we set some time ago.
When dealing with 3-wave structures, they are not as predictable or reliable as the standard 5-wave structures. This is why it feels like we are being whipsawed during these types of structures. And, the current environment is no exception.
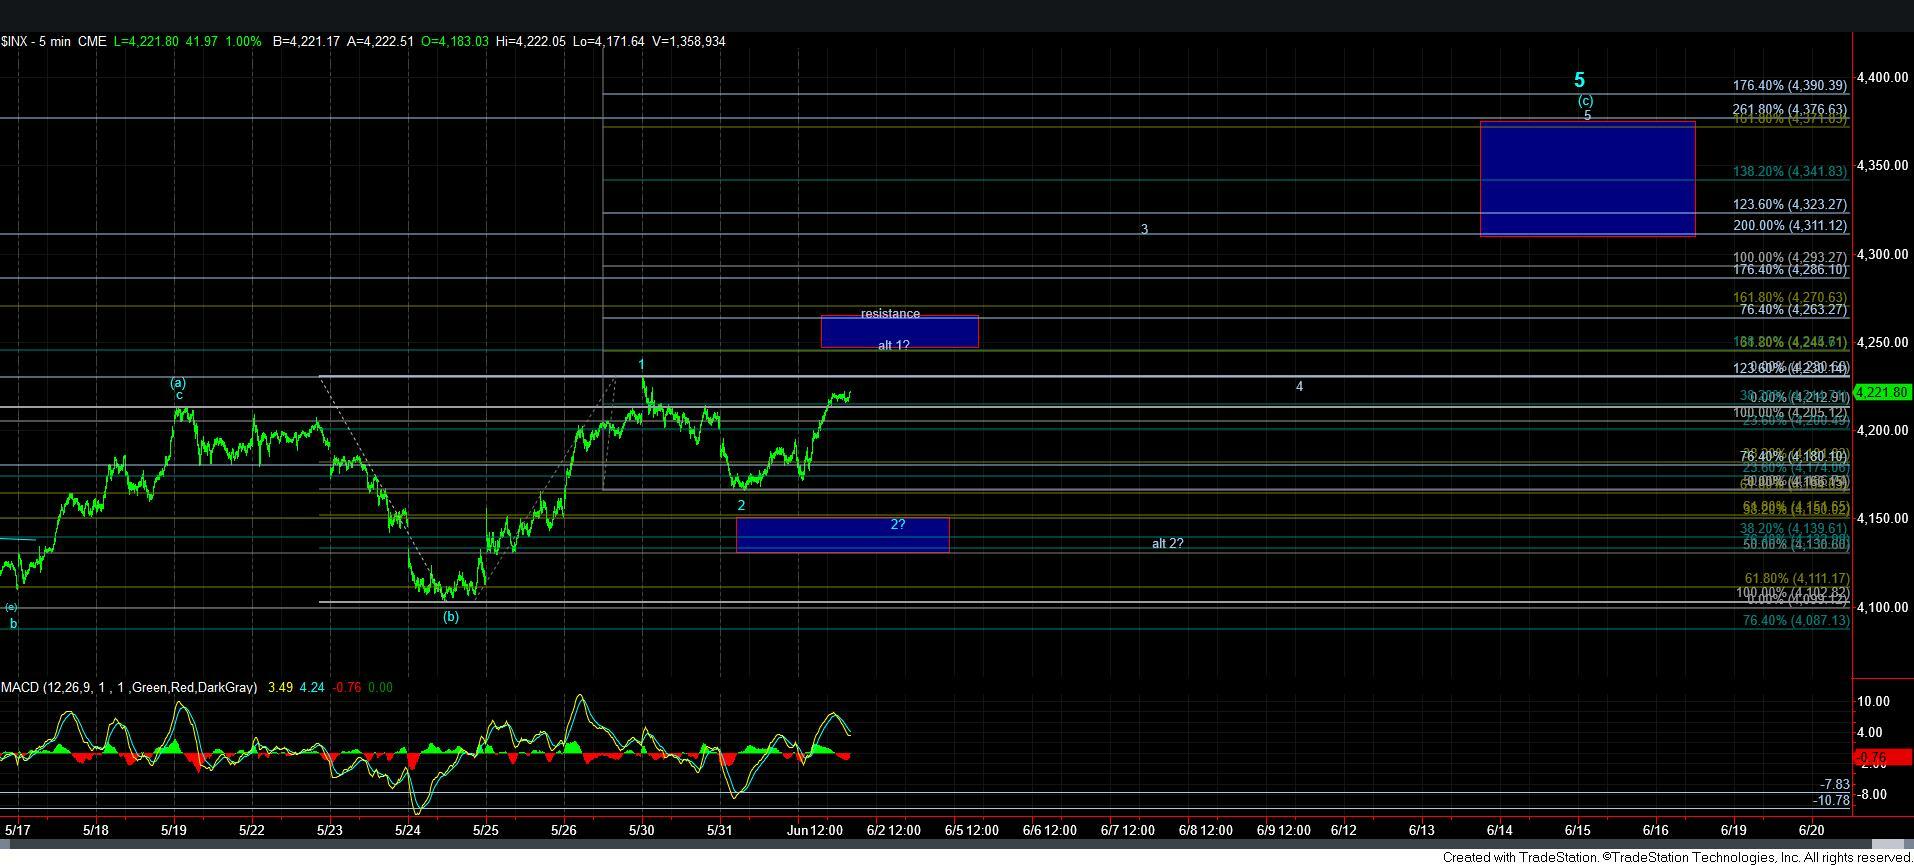
As the market currently stands, we are trying to track a [c] wave rally to the 4300+ region, which has been our expectation for many months. And, as per the primary count, it would seem that we are in the 5th wave of that [c] wave. Yet, we seem to have been subdividing as an ending diagonal.
With today’s rally, the market may have bottomed in wave 2 of the [c] wave of wave 5, as shown on the 5-minute SPX chart. Yet, due to the nature of these types of structures, I want you to keep it in the back of your mind that there is still some potential for us to swing back down to the support region below for a more expanded wave 2. For now, I would view that as an alternative.
But, what adds to the complexity of the current structure is that there are two paths we have now been tracking which can take us to 4300+. And, the 2nd path is presented as the alt 1 – alt 2 structure on the 5-minute SPX chart. Our resistance for that potential is currently in the 4245-4263SPX region. And, unless we can break out through that region, it forces me to track the alternative count as shown on the 5-minute SPX chart. This alternative would likely open the door to a rally to a little higher than where we currently have our target for wave 5.
Ultimately, I am still looking for the market to take us to 4300+ as long as we hold over 4130SPX. And, as I have noted before, it would take a break down below 4104SPX to suggest that a top has been struck a bit prematurely.
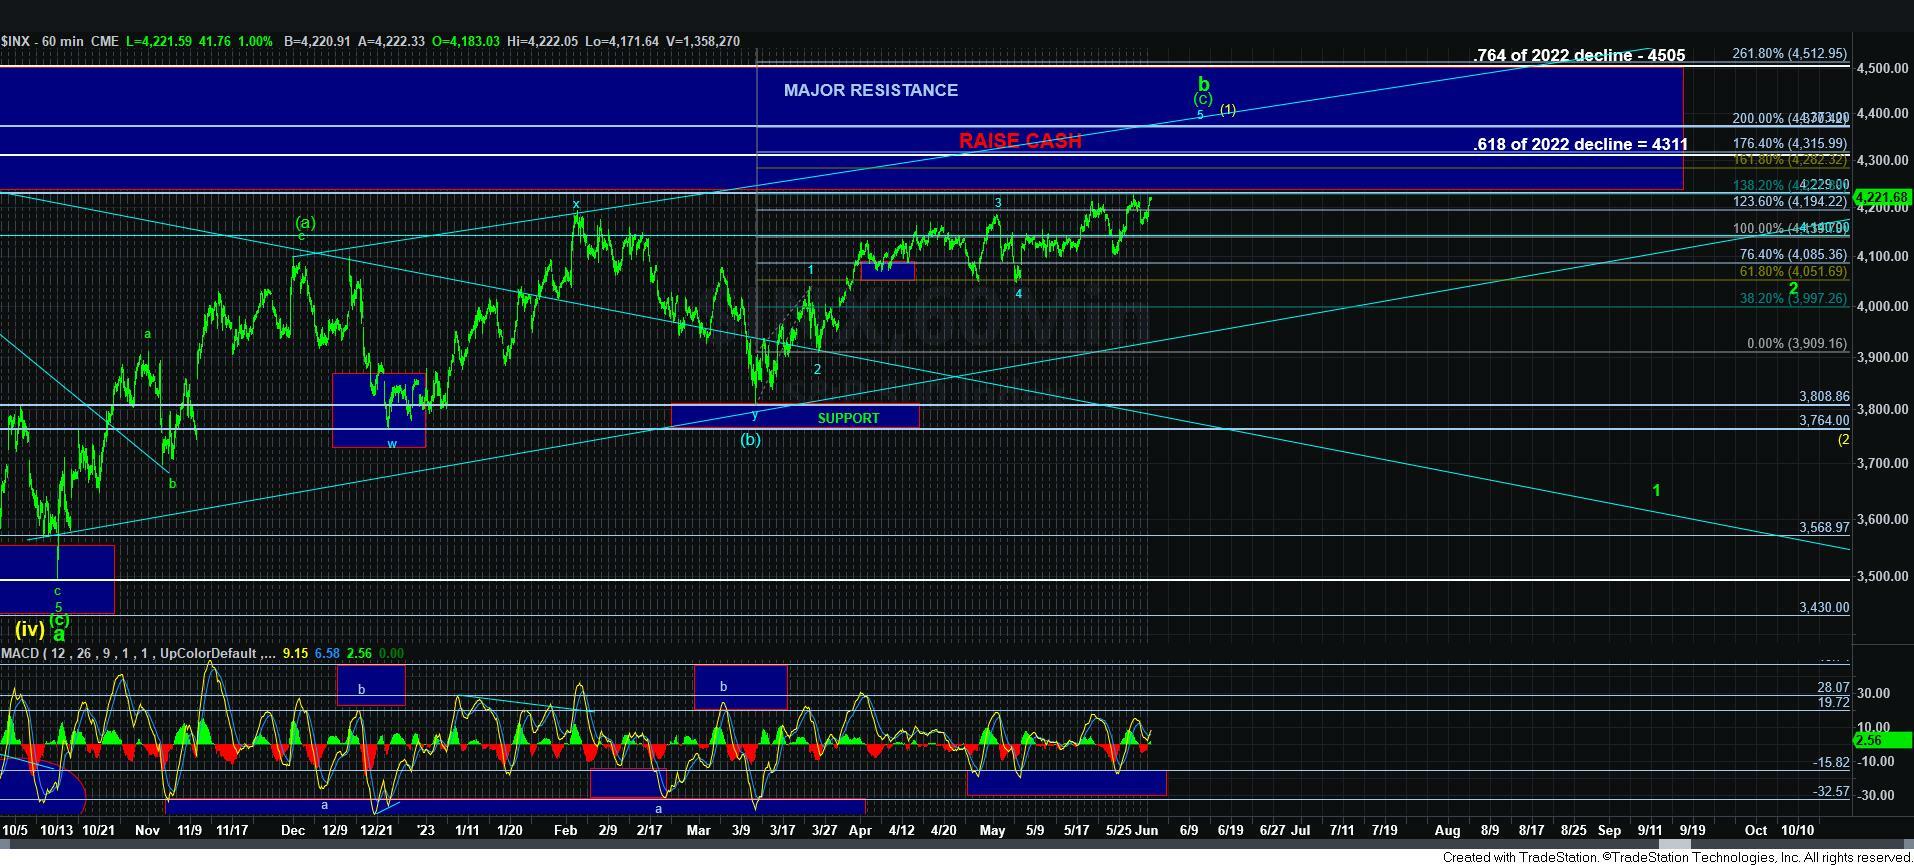
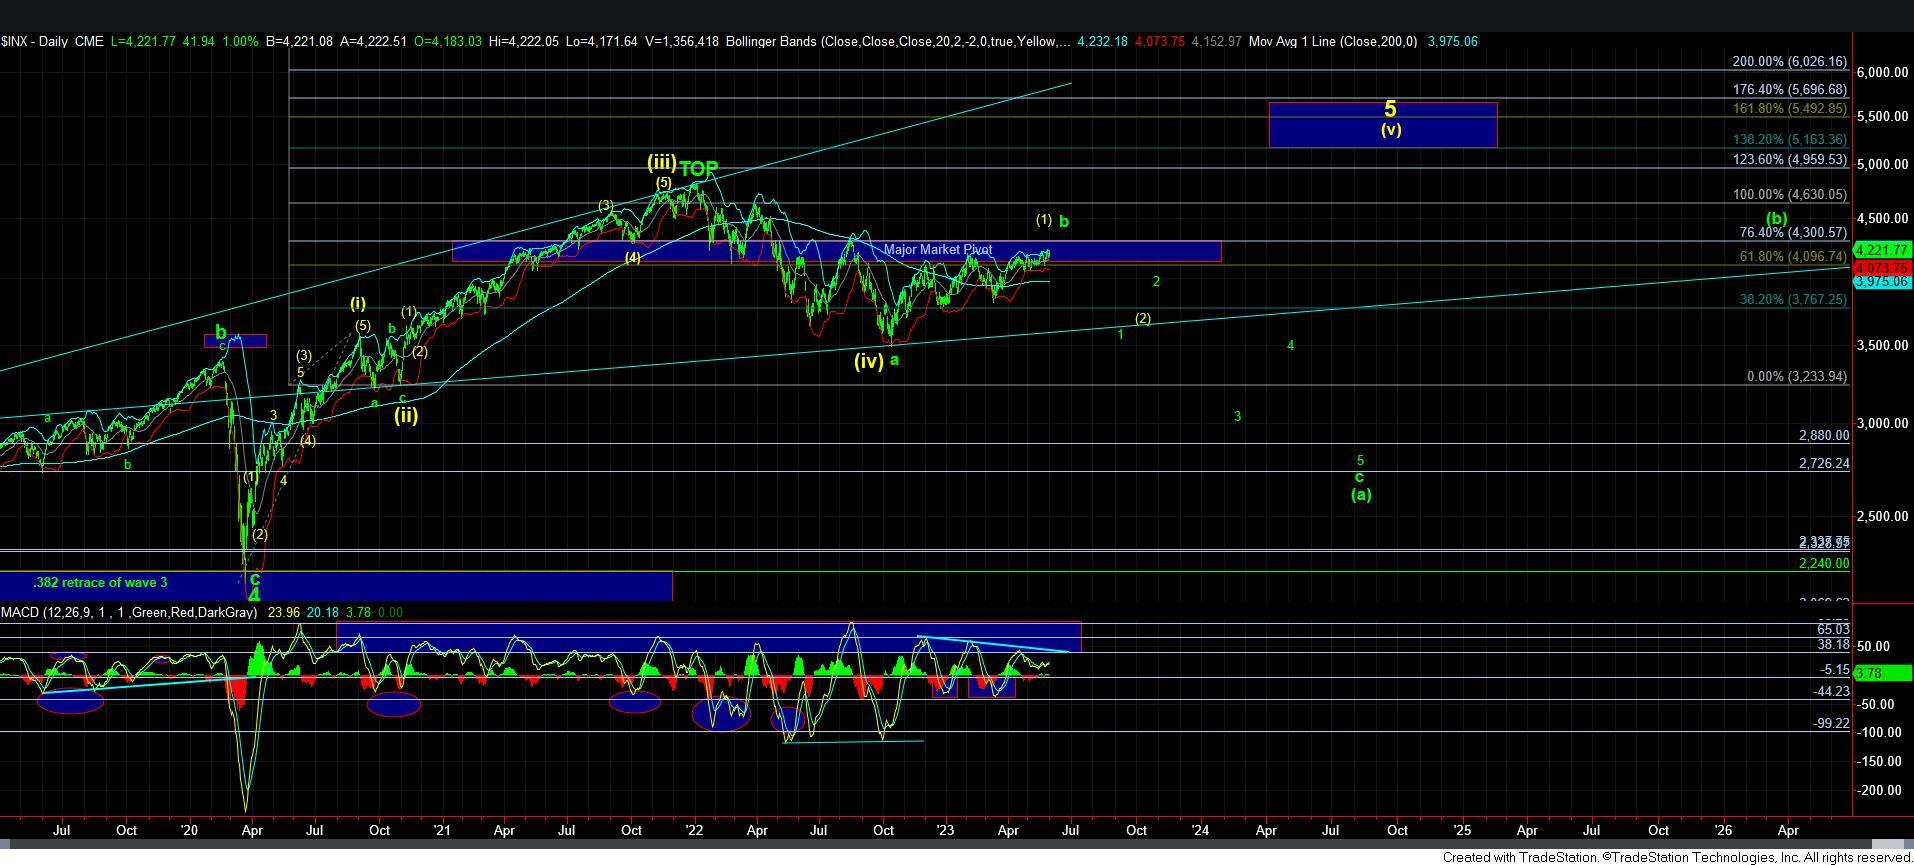
But, I want to again take a moment to point you towards the 60-minute chart, which suggests we are likely completing a topping structure in a rally which began back in October of 2022. Moreover, the divergences we are seeing on the daily chart MACD support our view of a topping structure.
Lastly, keep in mind that the nature of the decline once we break down below 4104 will tell us whether we have begun a set up for a crash later this year, or if the market is simply going to pullback correctively, and then next target the 4500-4600SPX region later this year or into early next year.
For the very near term, I still have my focus on levels over 4300SPX, as long as we remain over 4130SPX.