Three Strikes and A Wave Count Is Out
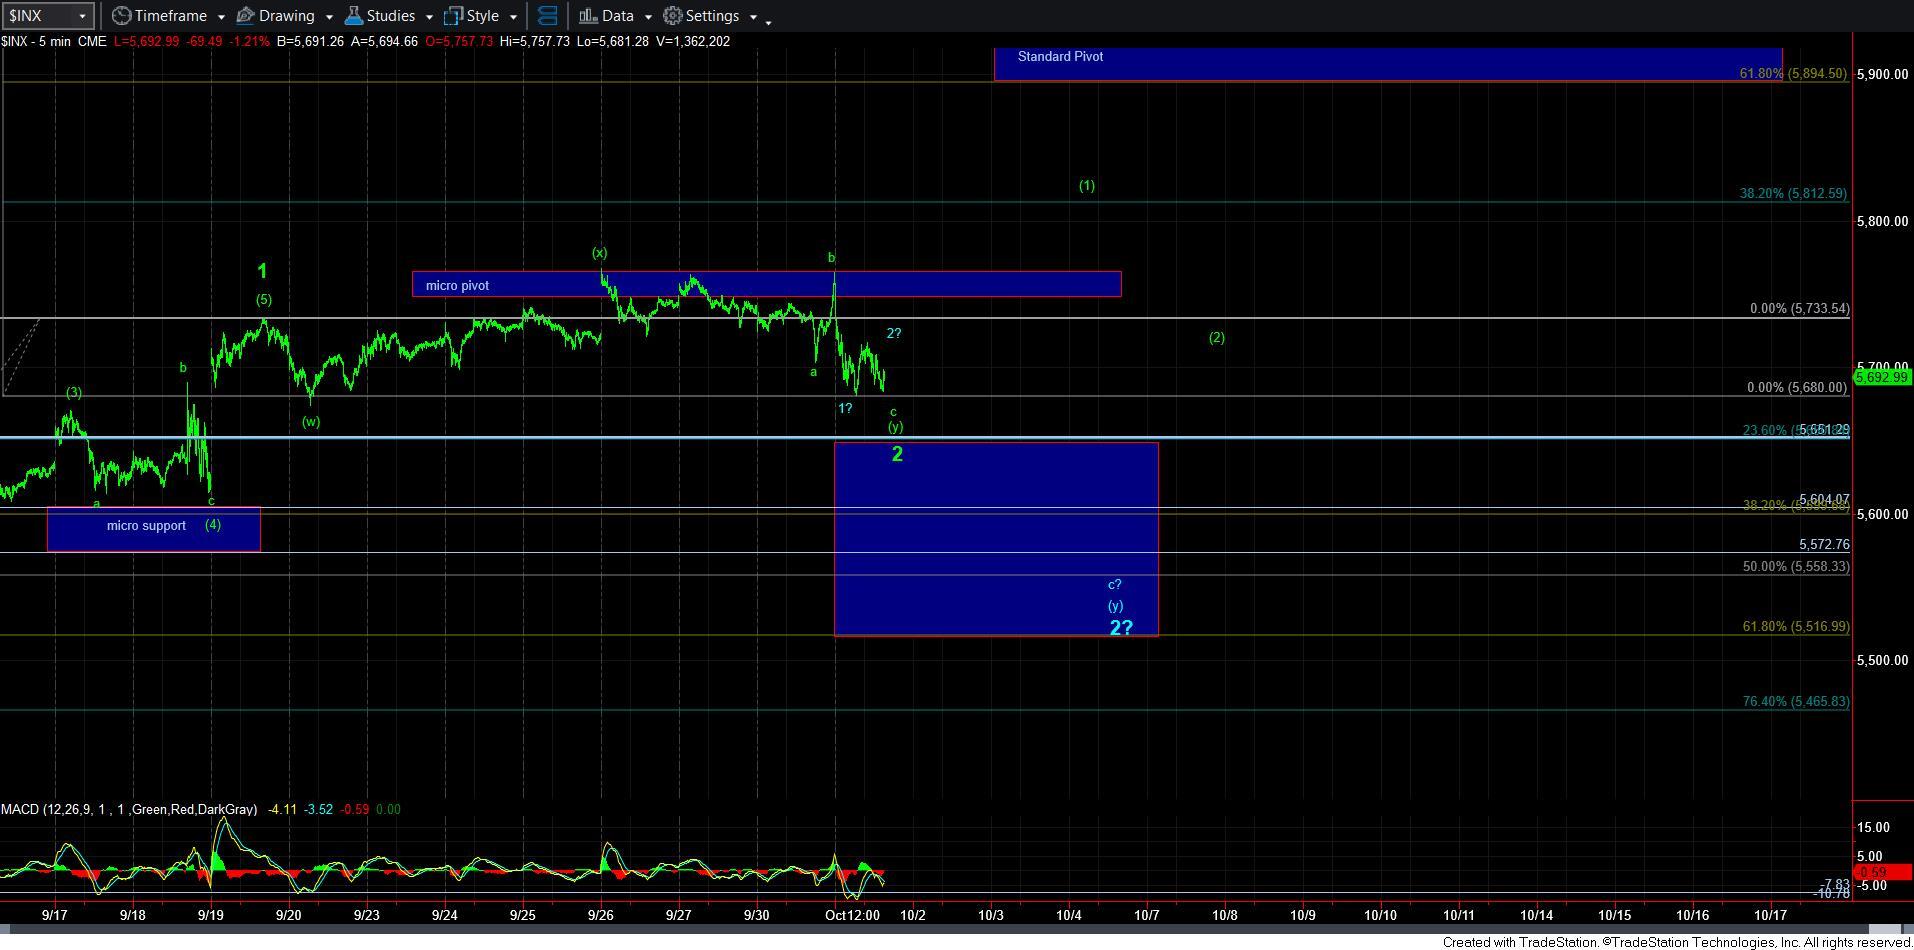
Until now, I have been tracking the potential for a wave structure to break us out sooner rather than later. But, as I have said over and over, until the market actually takes out the micro-pivot noted on the 5-minute SPX chart, I would prefer more of a reasonable 2nd wave to take shape. Yesterday’s end of day rally was the market’s third attempt at taking out that pivot, and after that failure, we have turned down to the point where I have taken off the more immediate break out scenario.
Before the market opened today, I posted an alert to our full-time members regarding a downside structure in place in the futures chart. While the market did take that path, it also dropped lower than the immediate bullish path would allow, and has made that immediate break-out structure much less likely and may even invalidate it as I am writing this update.
However, I had already modified the wave count to the larger degree wave 2 that I have been tracking, which you can now see on the 5-minute SPX chart. And, the question now is how deep can this wave 2 take us?
As you can see on the 5-minute chart, I am viewing two paths to this wave 2. If we remain over 5650SPX, then we can complete this 2nd wave within a [w][x][y] pattern with a simple 5-wave c-wave to complete the [y] wave. However, should we break down below 5650SPX, then we will likely see an extended c-wave down to the lower end of the target/support box, which would represent a .500-.618 retracement and a typical 2nd wave pullback.
So, until I see a CLEAR 5-wave rally structure begin from support over 5650SPX, I am leaving this door open for the deeper and more appropriate 2nd wave.
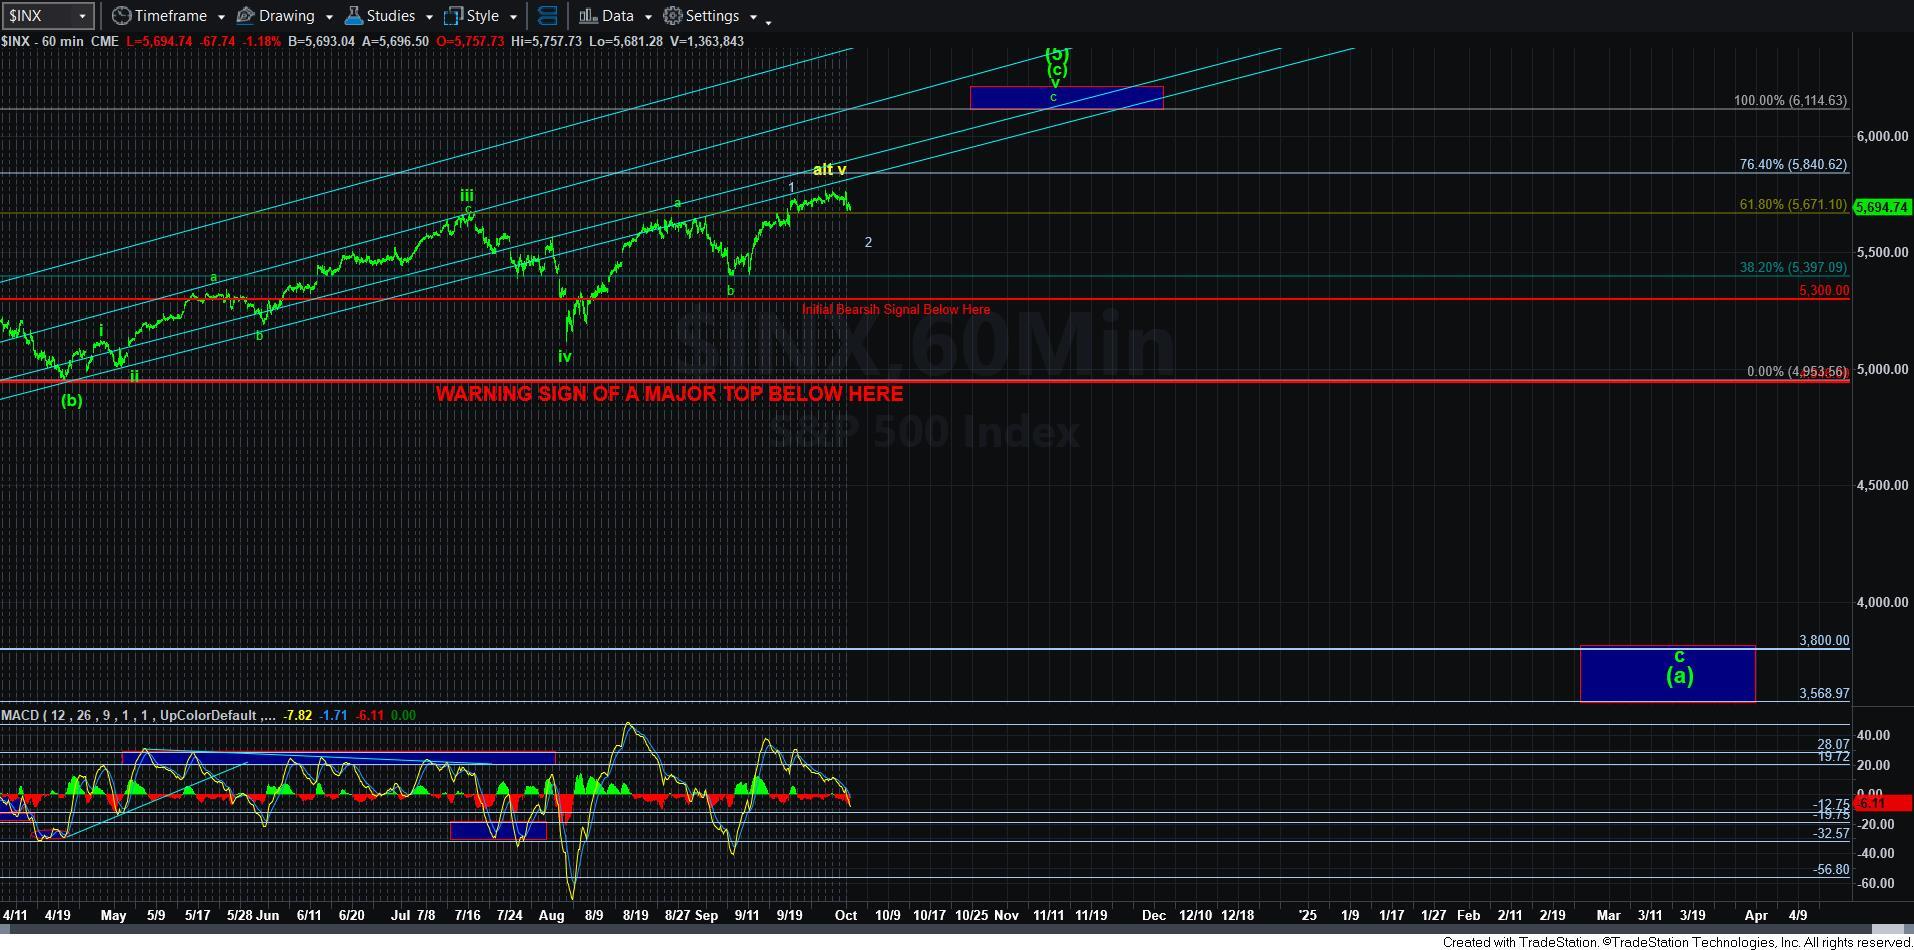
In the meantime, I am adding an alternative count on the 60-minute chart, which would suggest that we have completed this wave v in a shortened manner. This would mean the bull market is potentially over. While I still would need much more evidence to move to this alternative, the reason I have to at least consider this potential is again due to the IWM and NQ charts. But, please remember this is just an alternative at this time, and we need much more confirming evidence in order to adopt this as our primary count.
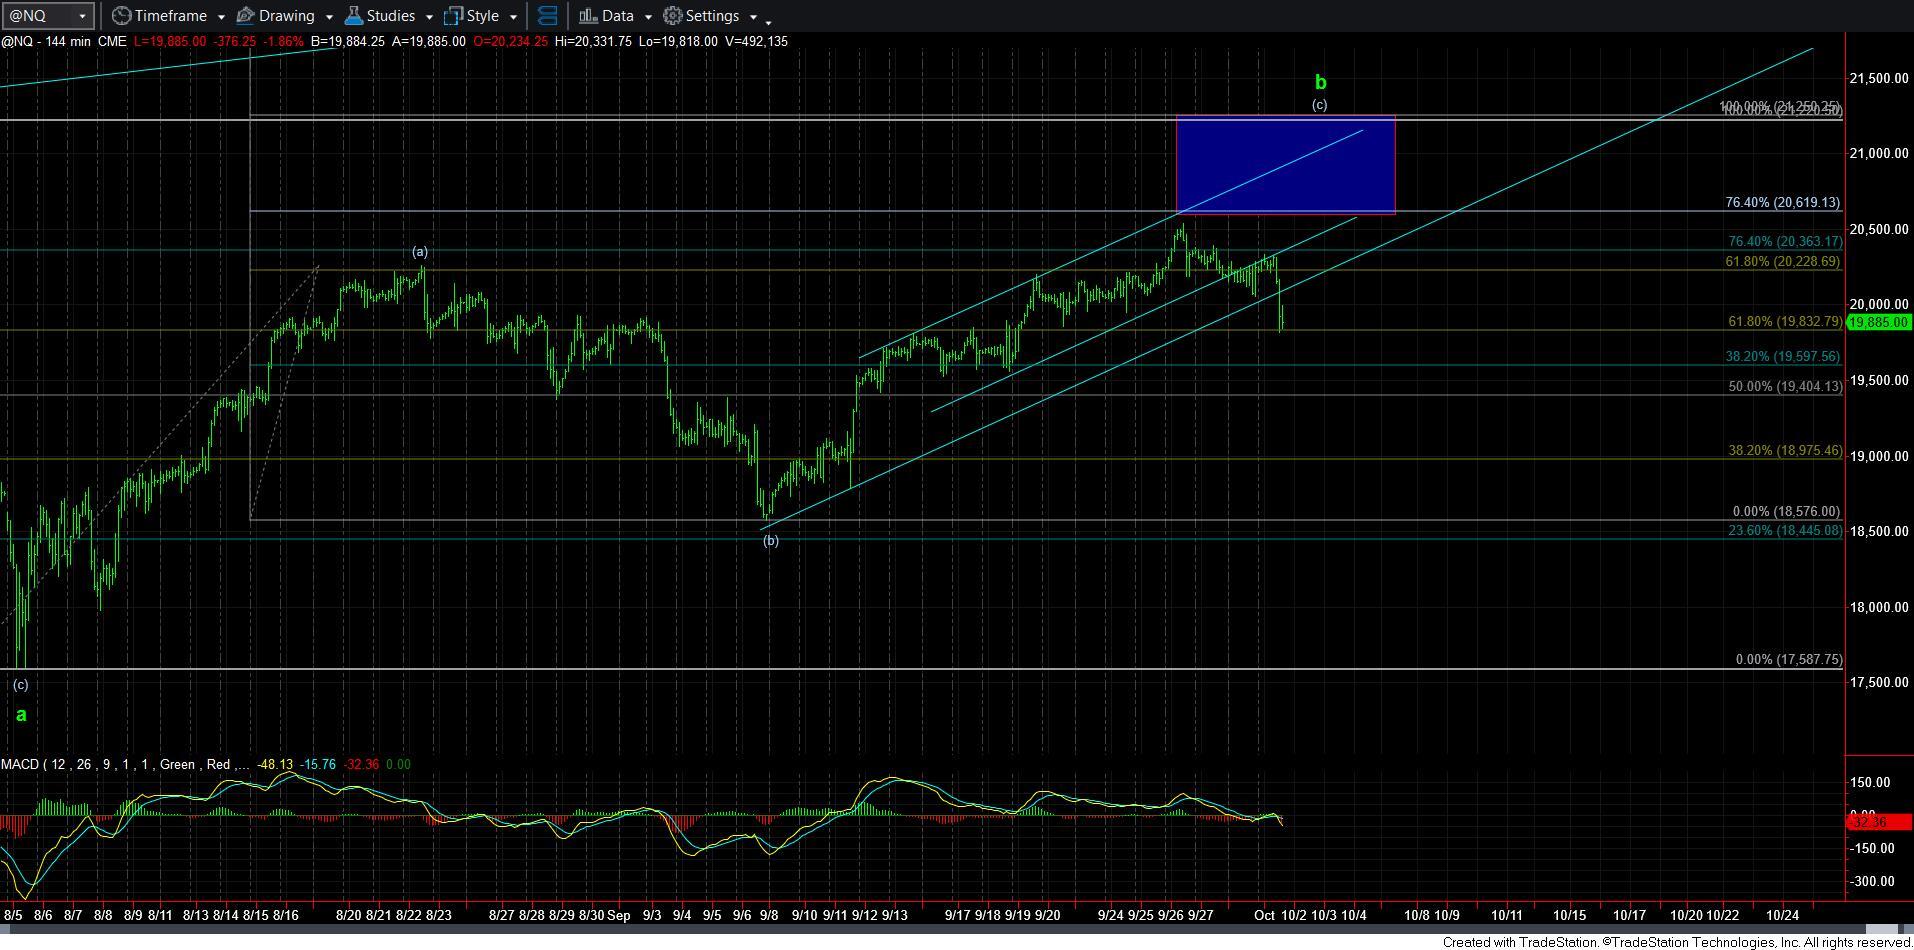
As you can see from the attached NQ chart, we have broken down below the uptrend channel, as shown. While this is not dispositive that a major top has indeed been struck, it is a piece of information we must consider.
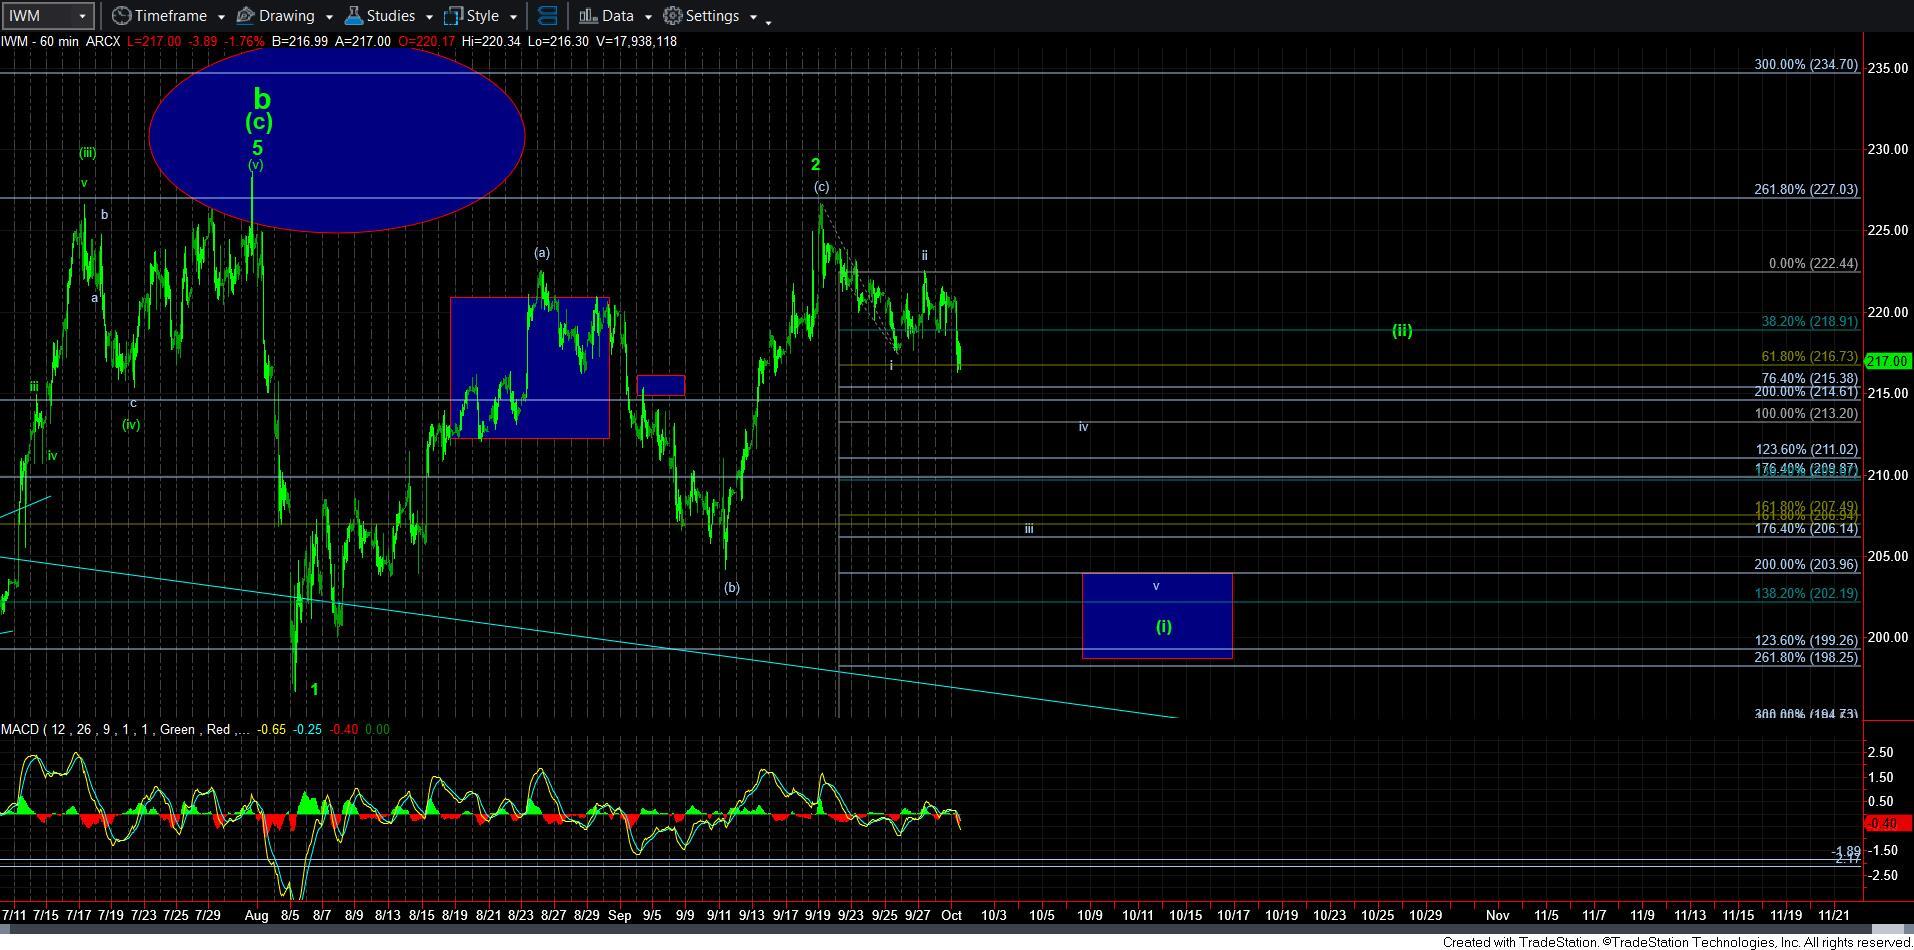
As far as IWM, it still retains a set up that can provide us with a bearish structure. We would need to see a 5-wave decline towards the 204 region for me to take this bearish structure quite seriously. So much so that I would likely be looking to short the market on a corrective wave [ii] bounce.
So, for now, I am still giving the bulls the benefit of the doubt, and looking for them to develop wave [1] of 3, or at least take out the micro pivot, before I will assume that wave 3 has indeed begun. Until such time, I am going to give the market a bit more room to provide us with a standard 2nd wave pullback in the coming days.
I also wanted to note that the Jewish holiday of Rosh Hashana begins tomorrow night, during which time Zac, Mike and I are religiously prohibited from working. Therefore, Garrett will be managing many services on his own, so I want to request that everyone please respect the workload Garrett will have on Thursday and Friday. Moreover, since the holiday goes through the Sabbath, my weekend update may not be out until Sunday. And, today’s update is likely my last afternoon full market update until Sunday, as Mike does the Wednesday update. Thank you for your understanding.