Three Paths Higher - Market Analysis for May 30th, 2023
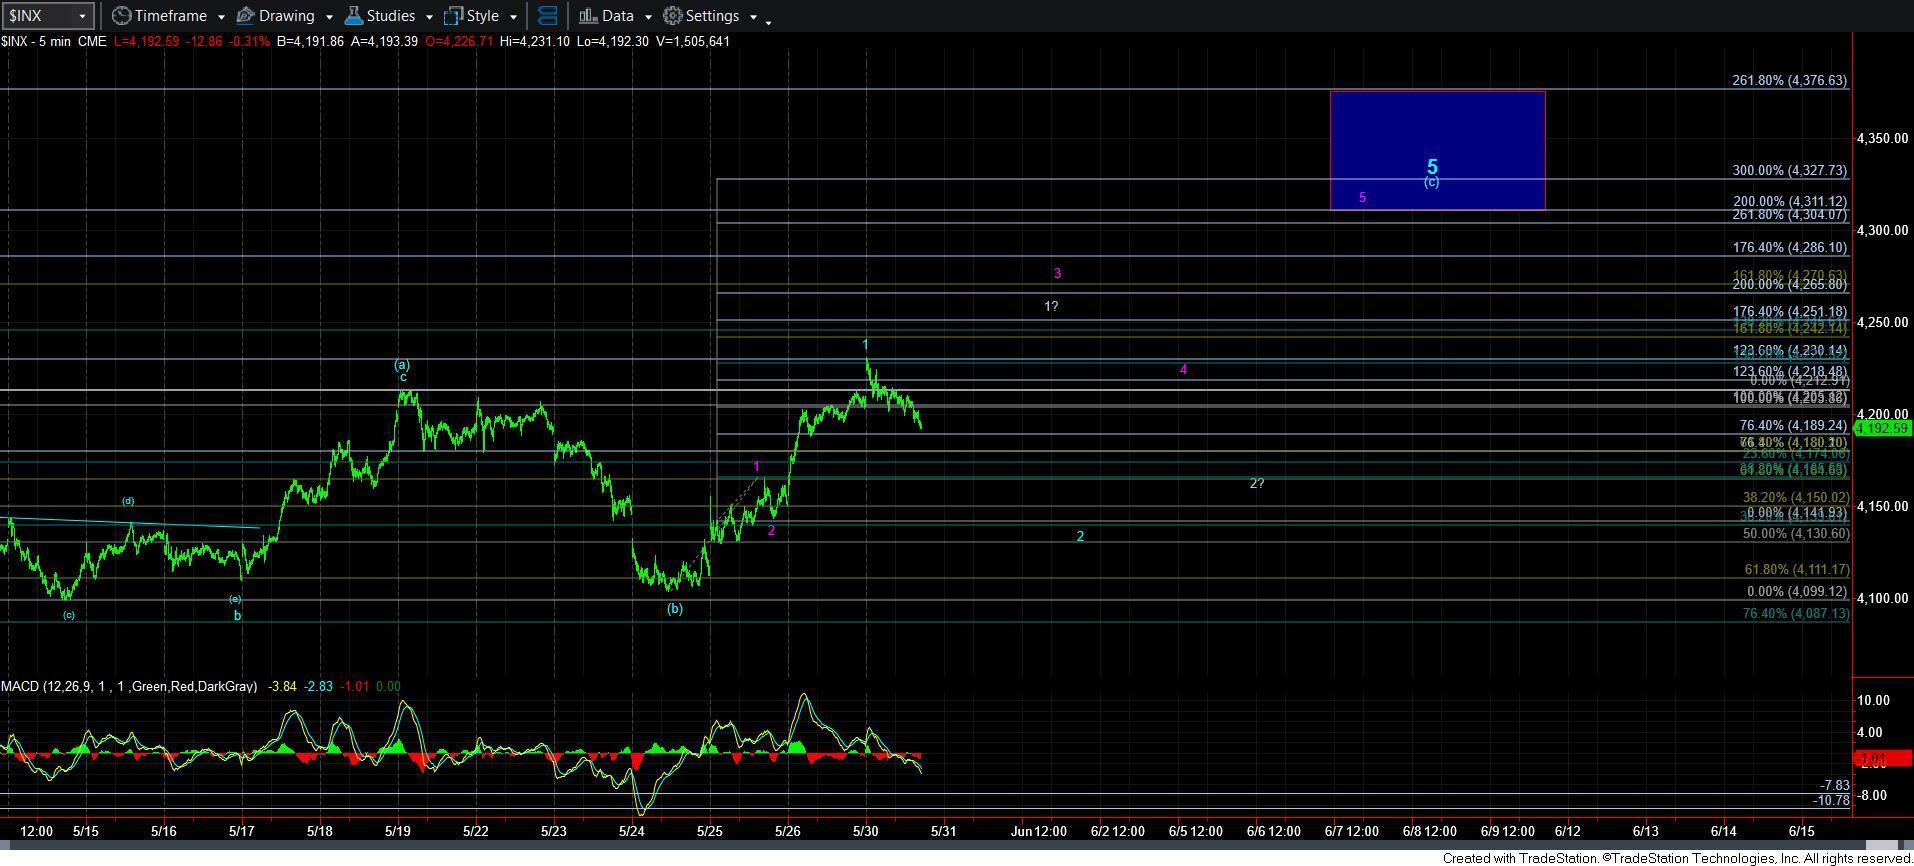
In my latest micro analysis, I have been noting the potential for 3 different micro-structures which can take us to 4300+. So, let me give you a bit more color on those potentials.
Let’s start with the 1-2 noted in purple, which is the lower 1-2 on the 5-minute SPX chart. In that scenario, the manner in which the market would take us to our target overhead, would be to hold the 4189SPX support, and then rally strongly to at least the 4265+ region over the coming several days. That would provide for a strong extension that is beyond the standard extension for wave 3, which should carry us to the bottom of our target overhead. But, as noted, a meaningful break of 4189SPX would make this potential significantly less likely to the point I would discount it.
The next potential is for us to hold the 4180SPX region, and continue towards the 4250SPX region for the 1?-2? structure. This would likely point us to the much higher levels I discussed in the weekend update. But, for now, I really cannot say this has my attention just yet.
The best potential to reach the target above seems to the 1-2 structure, wherein wave 1 topped today. That would provide us with an ending diagonal structure for the [c] wave. And, would be quite likely if we break down below 4180SPX before breaking back over today’s high.
So, unfortunately, due to the micro structure of the rally off last week’s low, the market is still leaving us with 3 paths pointing higher to complete wave 5. And, as I noted in the weekend update, how it plays out today and tomorrow will likely give us a better indication as to which path it will choose.
Ultimately, as long as the market remains over 4104SPX, I am still looking for a rally to take us to 4300+ before we strike a larger degree top. It would take a more immediate break down below 4104SPX to suggest that top has likely been struck. For now, I am still looking higher. But, I do apologize that I am unable to narrow down the paths more than I have in this update.
I want to conclude this evening’s update with something I posted in the trading room earlier today:
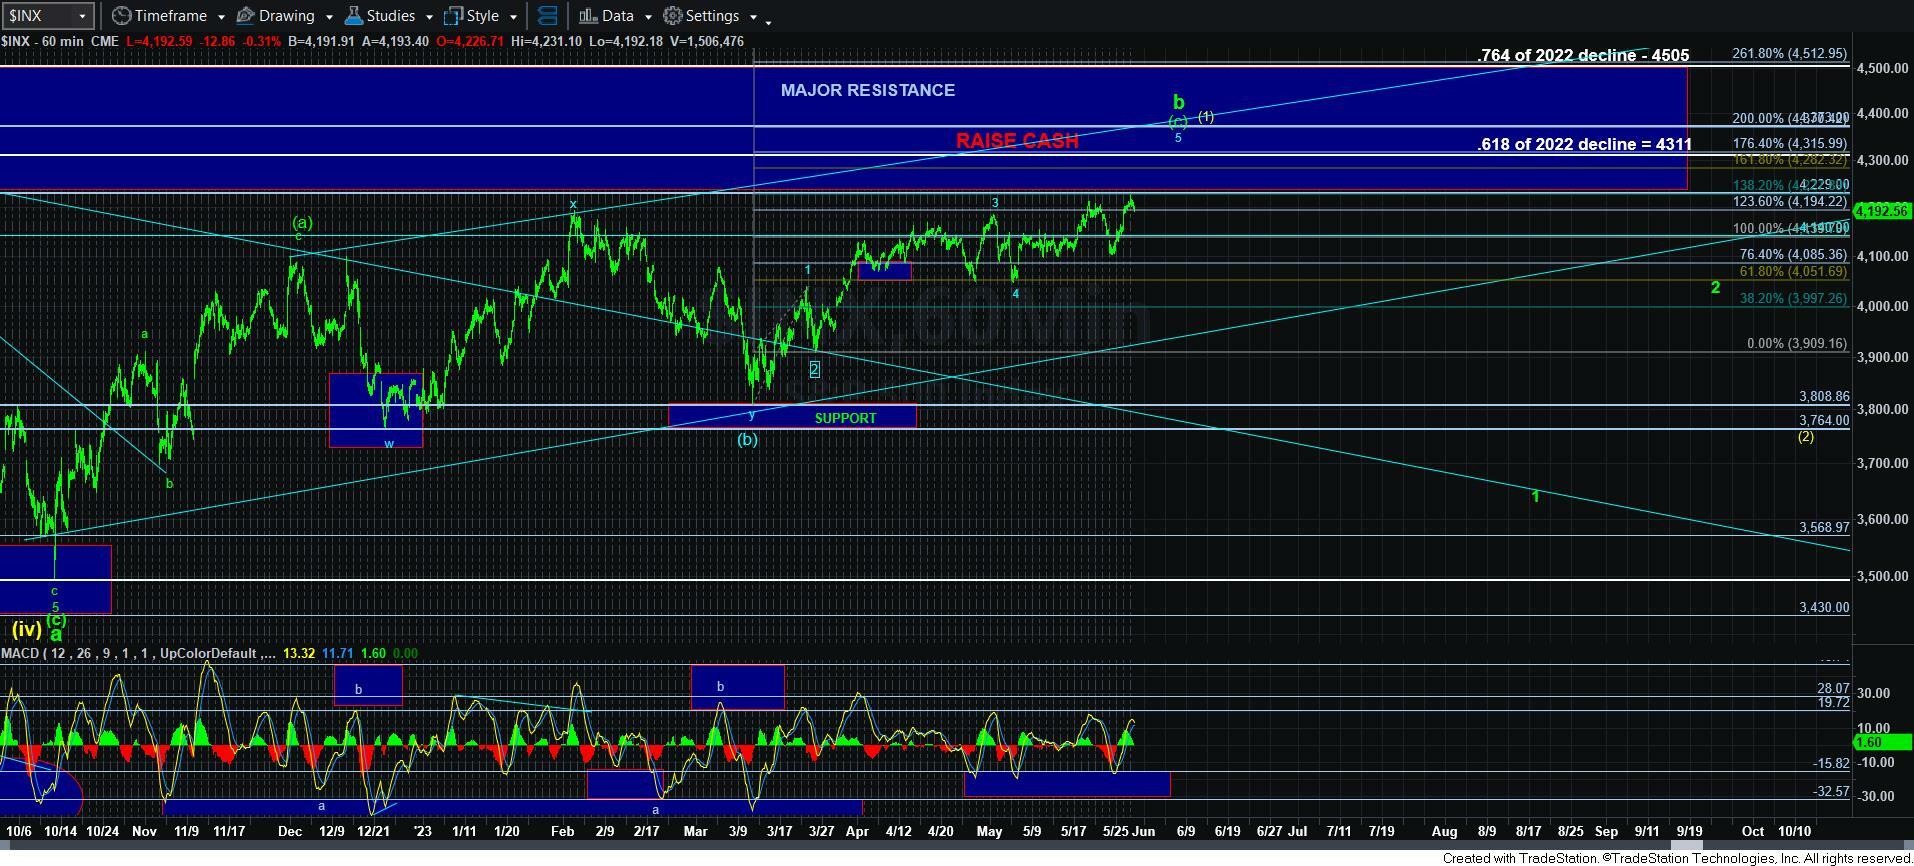
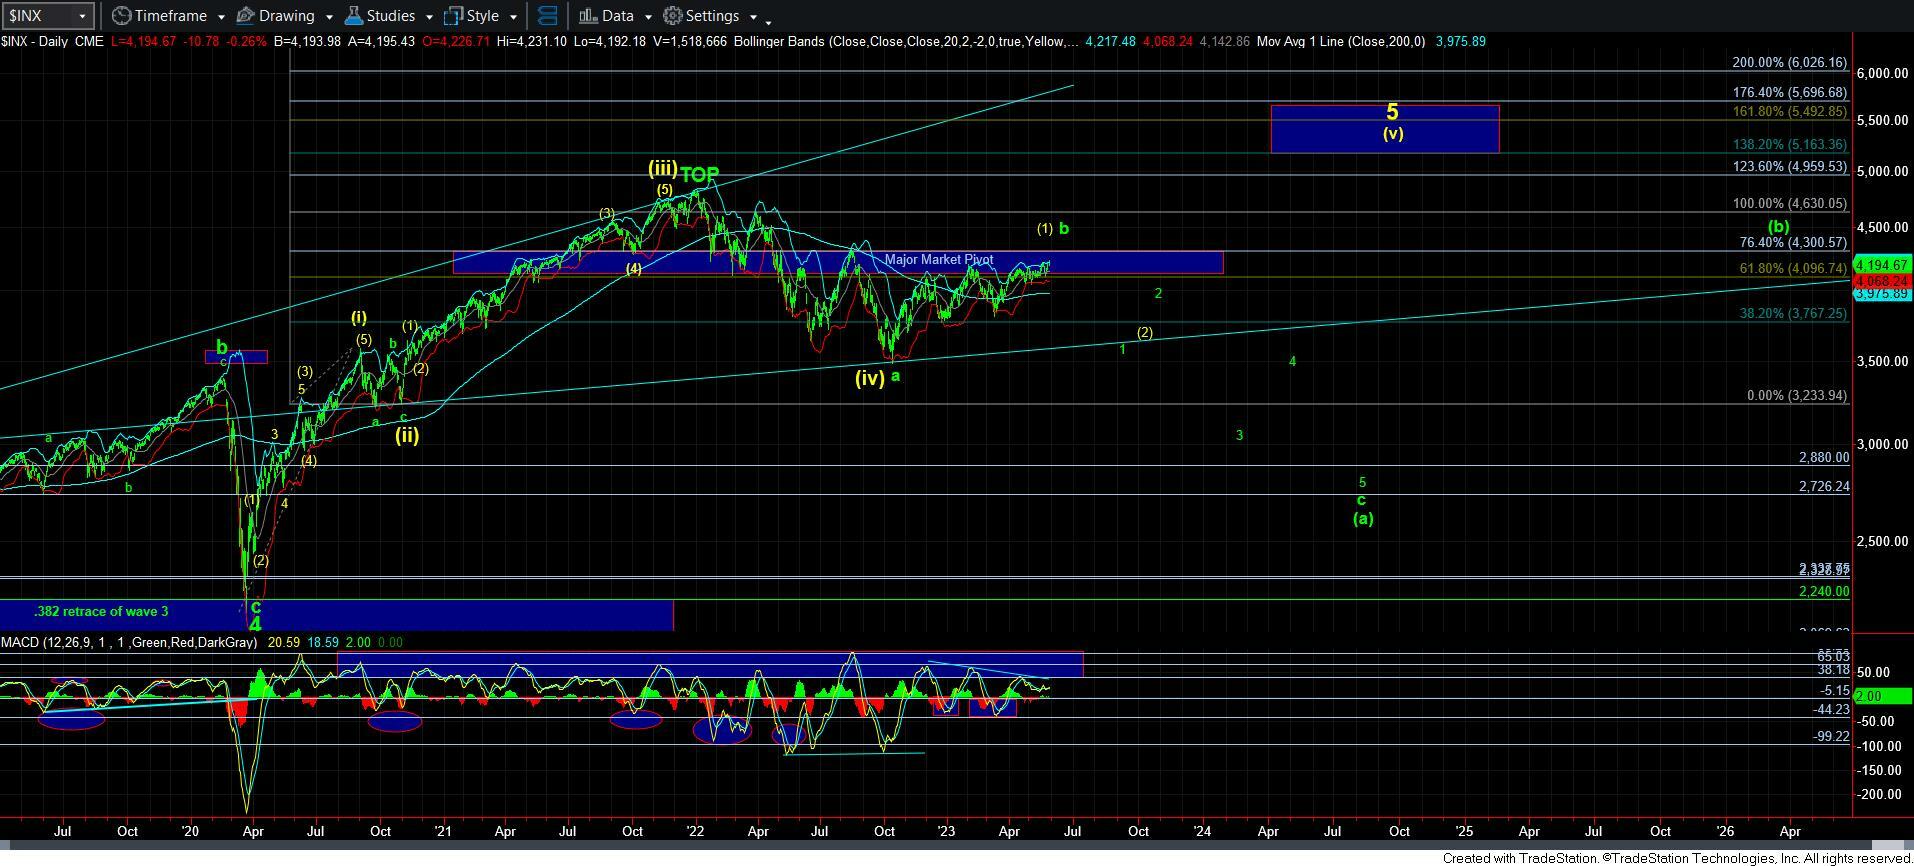
“I just have to advise keeping the bigger picture in front of you at all times in SPX. While there are still a number of stocks that can extend a rally over the coming month or so, the daily SPX chart sports a rather ominous and long negative divergence on that MACD. And, as you can see, we are entering our MAJOR resistance zone on the 60-minute chart. For now, 4104SPX is our main support. But, based upon how the market sets up this week to potentially push higher, I am quite sure I will be able to move that support up.
And, should we break whatever support we will be dealing with, that will likely be our initial signal that a larger degree pullback is in progress. The nature of that pullback will be instructive for our expectations for the rest of 2023, and potentially beyond.”


