This Is Likely Only The “Initiation” Move Off The Highs
With today's major damage done in the market, I think it makes it quite likely that we should not expect any major recoveries into a bullish trend anytime soon. The 3011-45 resistance region on the S&P 500 (SPX) has certainly turned us down hard as we expected, but it seems that the market truly turned overly bullish up into that resistance.
The reason I note what I just did is that the manner in which we have now declined has wiped out the gains from both June and July in less than a week. Moreover, when the market declines this precipitously, it is often indicative of there being an absence of short sellers in the market. It is the short sellers covering their shorts which often provide the corrective bounces we see in a market decline. The fact that we have experienced almost no bounce seems to suggest that the great majority in the market were caught looking to the long side while we were hitting market highs into our major resistance/topping zone. This seems to suggest very few “out there” were expecting any bearish market action.
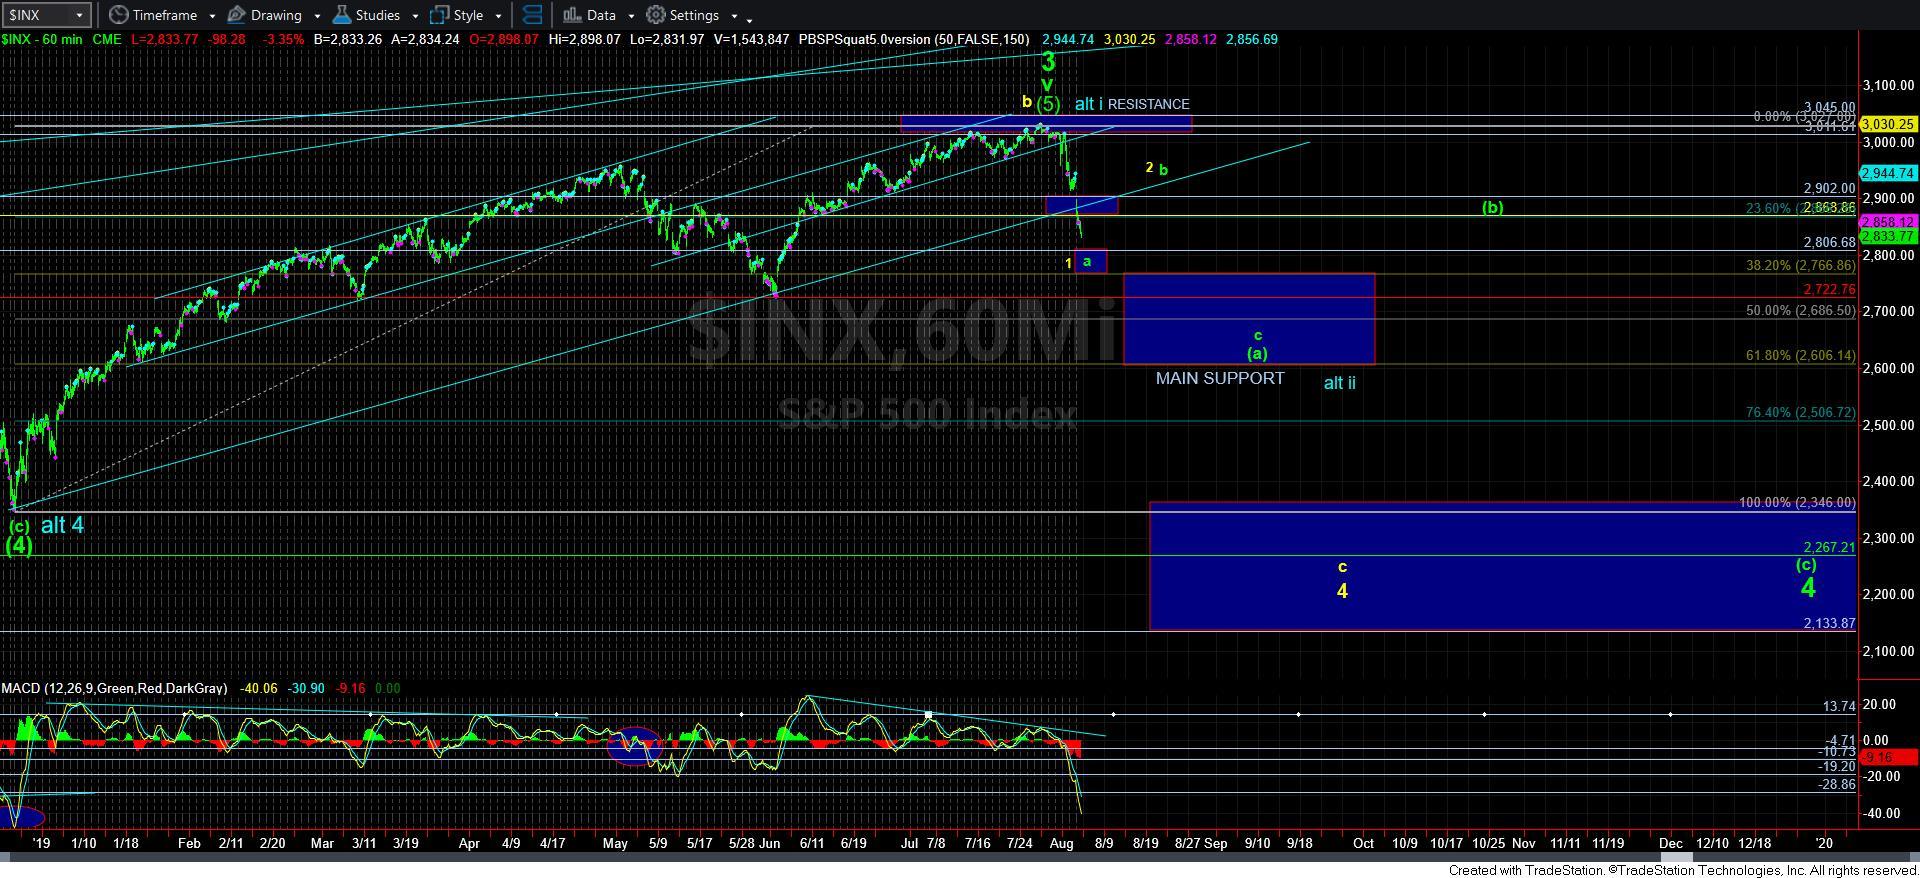
With the market now breaking down even a bit lower than I had expected for our initiation move, we are approaching the top of the major support box on the 60-minute chart. Even if I were to take a very bullish view of the market – as per the blue count – this initiation move is approaching the .382 retracement region (the top of the box) of the entire rally off the December lows. That is a most common target for an a-wave decline – again, even if this were the most bullish case scenario.
Ultimately, it means I think it to be reasonable to expect a bounce in the near term, which could very well just be a b-wave, as presented in green. Also, it is reasonable to assume it can rally back up towards the bottom of the trend channel before it turns back down in the c-wave lower.
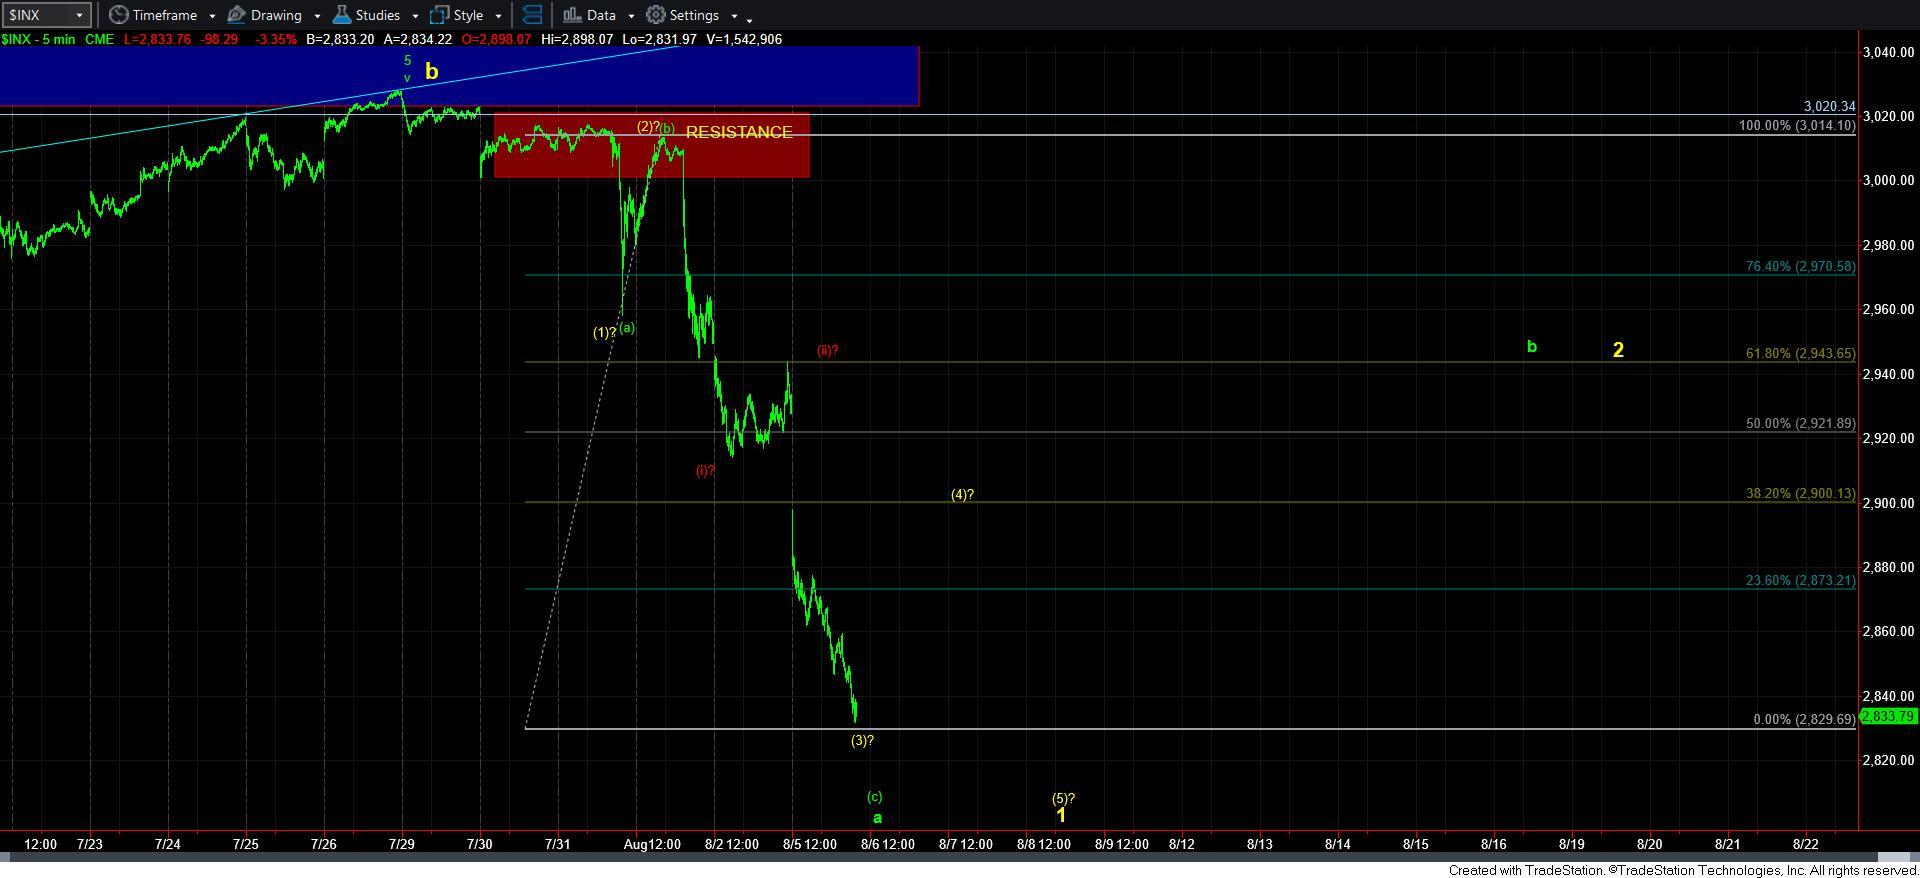
As far as the yellow count, well, if this were the operative count, then we are still only in the 3rd wave down of wave 1 off the highs. That means we would still need a corrective 4th wave, followed by a 5th wave lower. In other words, this drop has gone too far to be considered a 5th wave of wave 1 down, and is likely still only the 3rd wave down. So, this count will still remain on the chart, but I cannot say that I will give it heavy weight just yet. For now, the primary count remains the green count.
Our next support region resides in the 2765-2810 SPX region, as shown on the 60-minute chart. How the market reacts as we head towards that support will likely tell us if we are indeed dealing with an a-wave, or if we can get a full 5-wave structure for the yellow count. Again, for now, I am viewing this as the a-wave of a larger corrective decline, as presented in green.
For now, I have to be a bit of a spectator until the market gives me more of a structure to work with. This means that either we see a corrective bounce for a wave (4) in yellow, as presented on the 5-minute chart, or we break out over 2900, which would provide us with the b-wave rally.
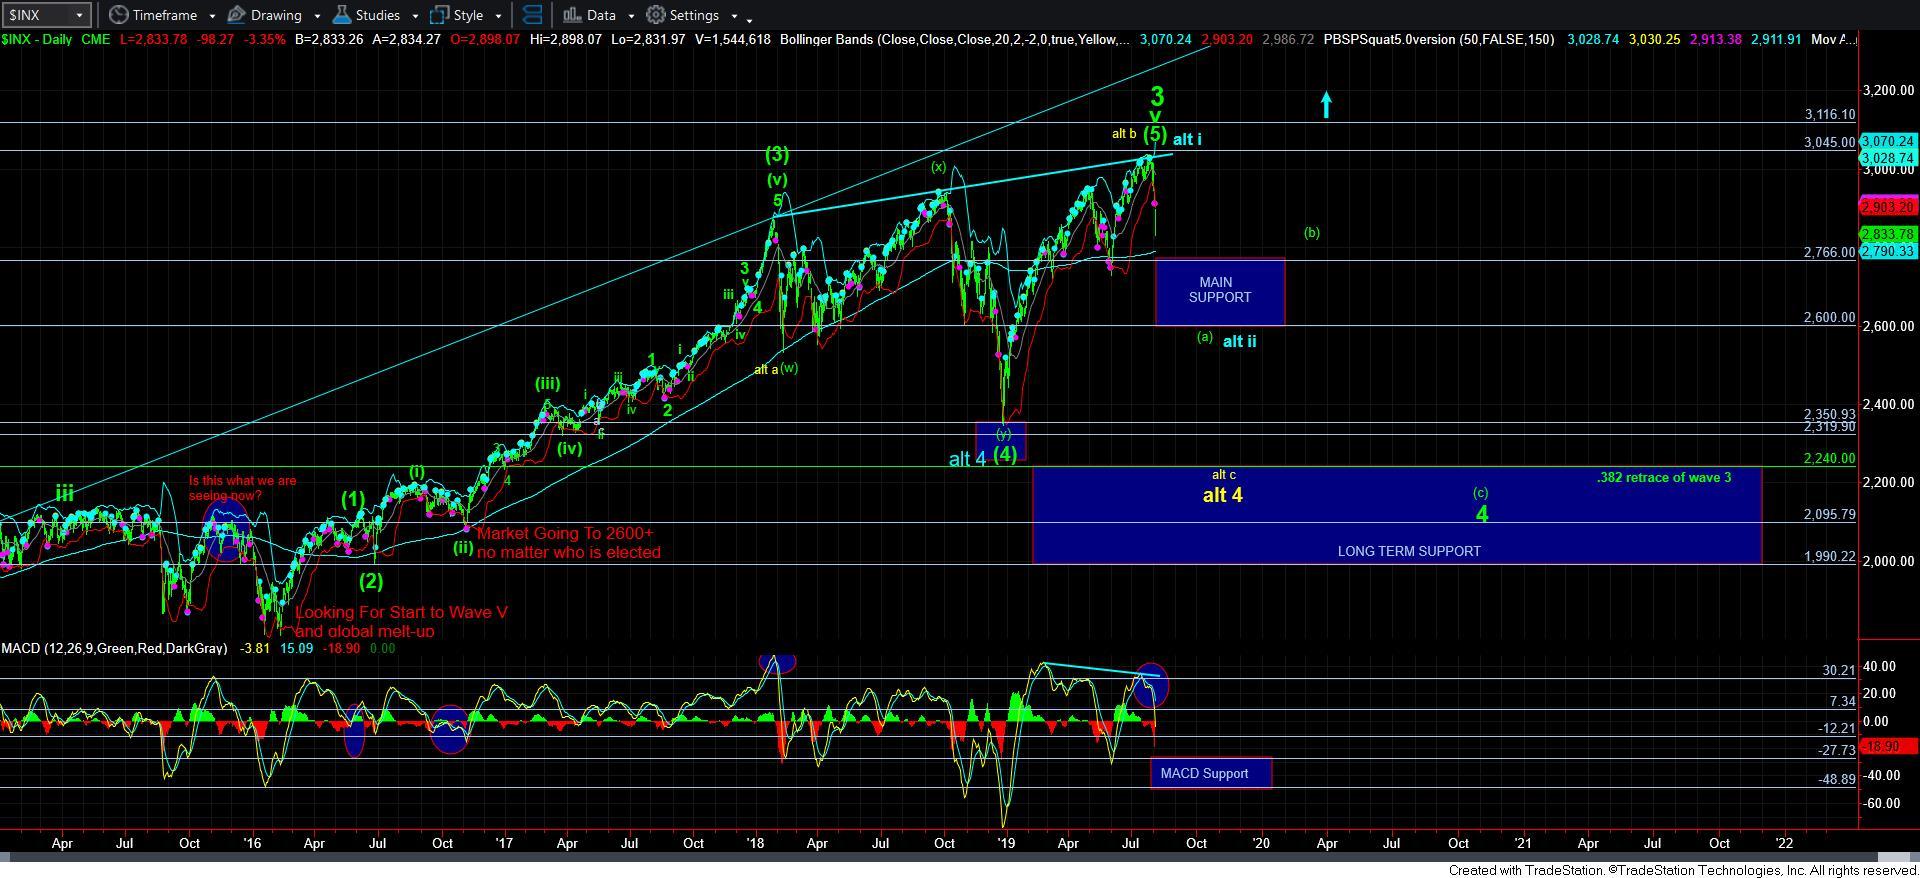
I also want to highlight that as we drop, the upper target for our 5th wave off the 2009 lows is approximately 1000-1200 points higher, whereas the potential for a bigger 4th wave target resides about 600 points lower. The further we drop, the more you have to be cognizant of the risk to reward you want to be taking within the market. But, for now, I still would expect to see lower into our support box on the 60-minute chart before I would consider anything more immediately bullish other than a b-wave rally.