This Ain’t Gonna Be Easy
This is what I wrote an hour ago:
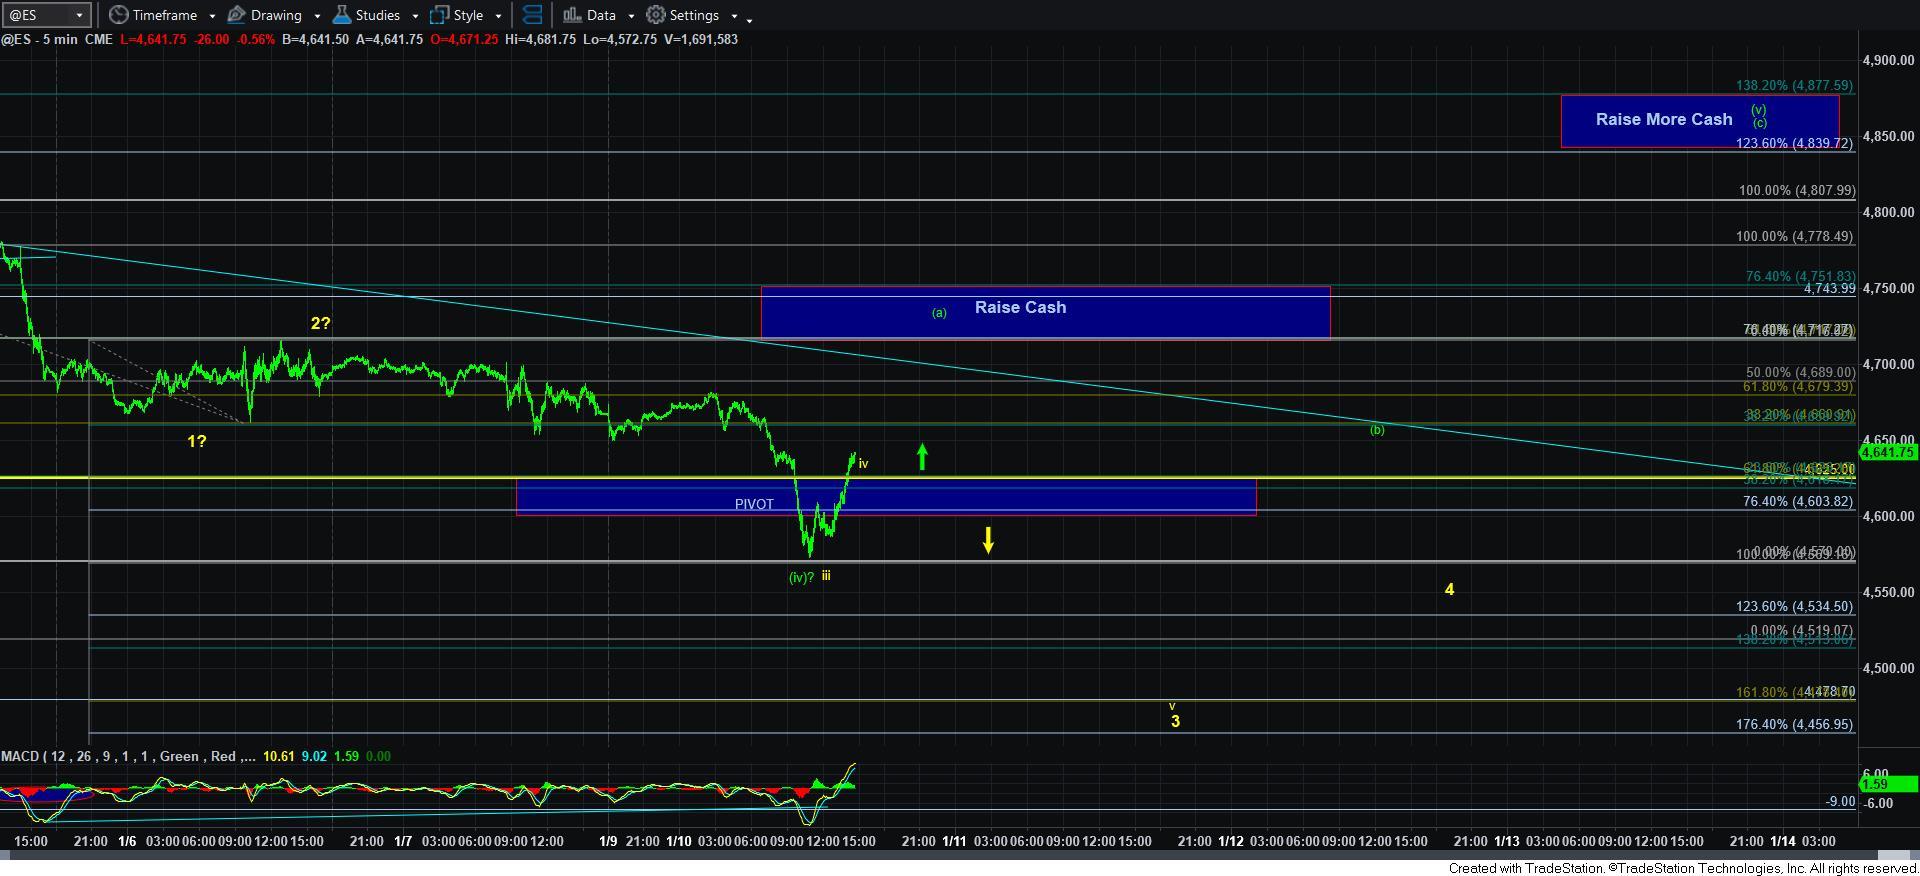
“Yes, I know the market has now broken down below support I outlined in the weekend update. And, yes, I know this now increases the potential for the yellow count in a more direct drop to the 4400 region. But, I have to be honest with you and tell you that there are a lot of problems with this yellow count direct drop, and the next 24-36 hours will likely seal the deal either way.
You see, in order to develop a nice c-wave down, you really need a clear 5-wave decline off a high to suggest that the c-wave down has begun. With a direct break down today, I cannot say that we now began with a clear 5-wave decline off the high. It is a very questionable initial 5-wave down off the high, and really counts best as a 3-wave decline.
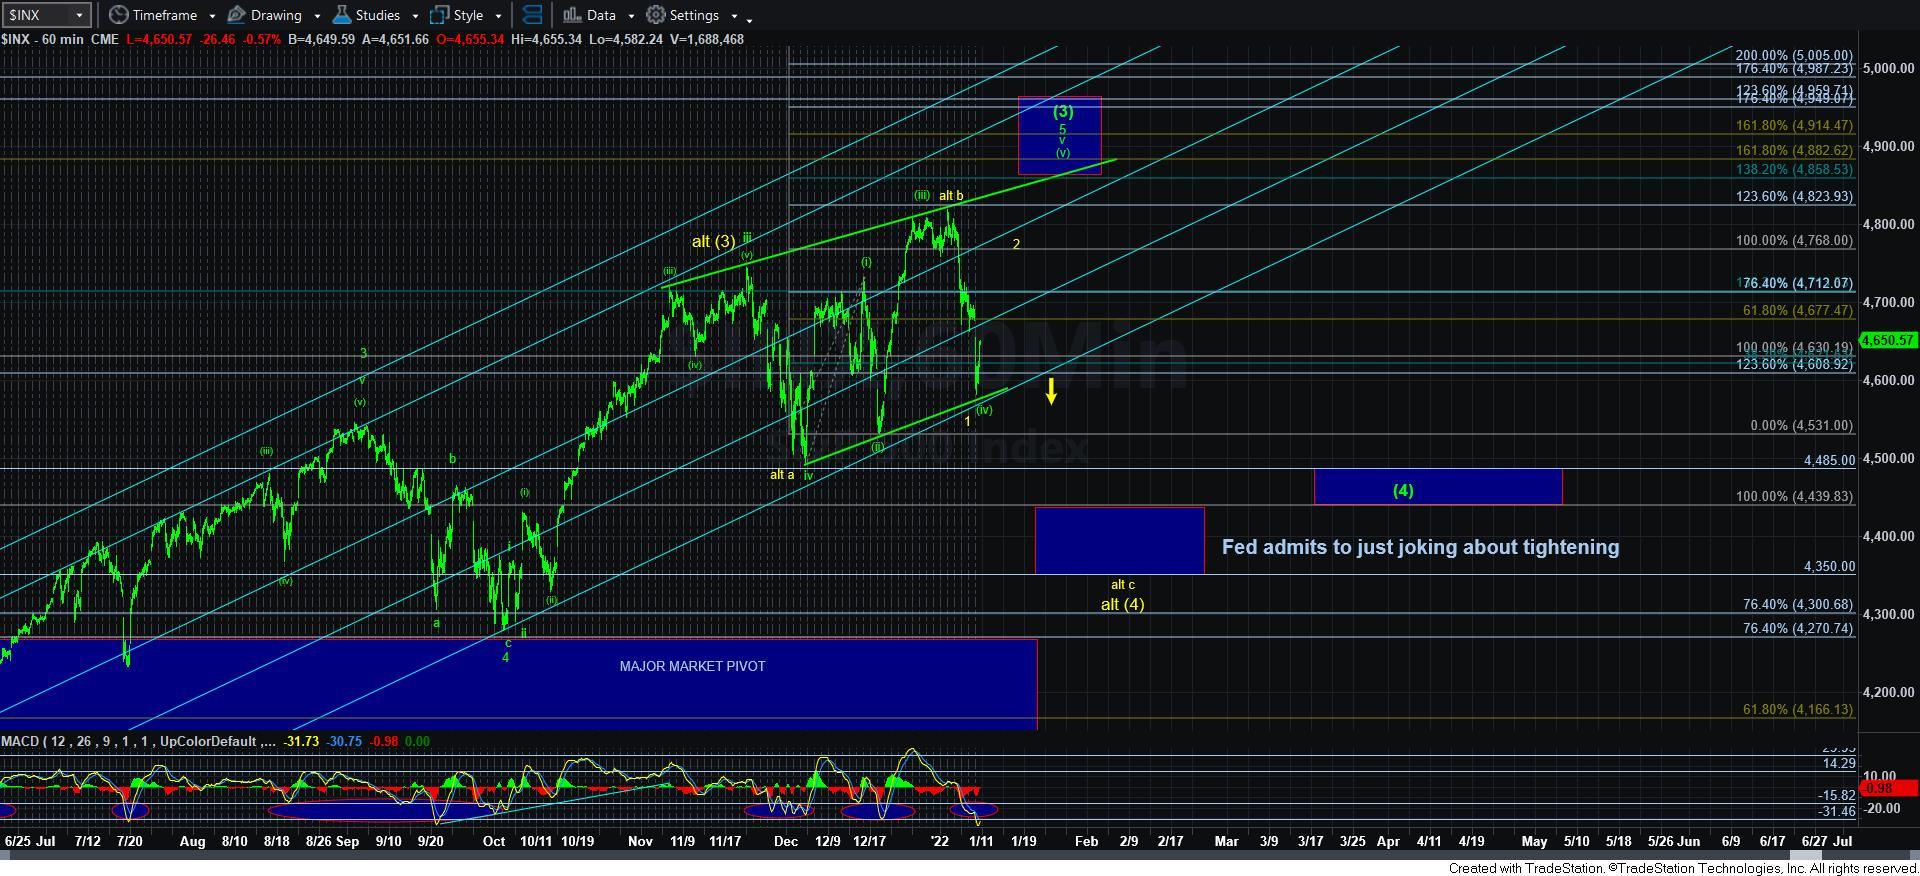
Furthermore, the market is now as oversold as it was in October of 2020. Yes, we are now more oversold on the MACD on the 60-minute chart than we have been in almost a year and a half.
So, while I want to get resolution in this region already, the best I can provide is saying that there is now probably a 50/50 split in my eyes between yellow and green. And, how the market handles this pivot is going to be the key for us in the next day or so. IF the pivot holds as resistance, then it points us down to the 1.618 extension for wave v of 3 in the 4480ES region. But, if we break out over the pivot, then either this c-wave in yellow is taking shape as a big ending diagonal, or we are indeed heading back up to complete a bigger wave [3] in green.”
And, while the market did break our support, it dropped down to an a=c level where it bottomed today. Moreover, the drop into today’s low does not have a reasonably clear structure either. So, it leaves me still hanging onto the green count, despite how difficult this has been in this region. And, in truth, it still makes the most sense out of all the potentials I am tracking.
As far as yellow, well, there are several paths that can still take us down there. But, all paths suggest we have to break down below 4570SPX now. I am sorry for changing the goal posts in this region, but this pattern has turned much more complicated than I have expected it would. In fact, most people would probably be best off not trying to trade these gyrations, as it will likely just continue to be complex. You see, even if we go down in yellow, it is likely only going to resolve as an ending diagonal down in the yellow c-wave. And, if we go up in green, it will likely just provide us with an a-b-c to complete its ending diagonal. However, you slice this, it will be complex and difficult to trade due to continued expected whipsaw.
Therefore, most of you would be best off in continuing to review your holdings and prepare for what I think eventually will be a buying opportunity once this region finally resolves.
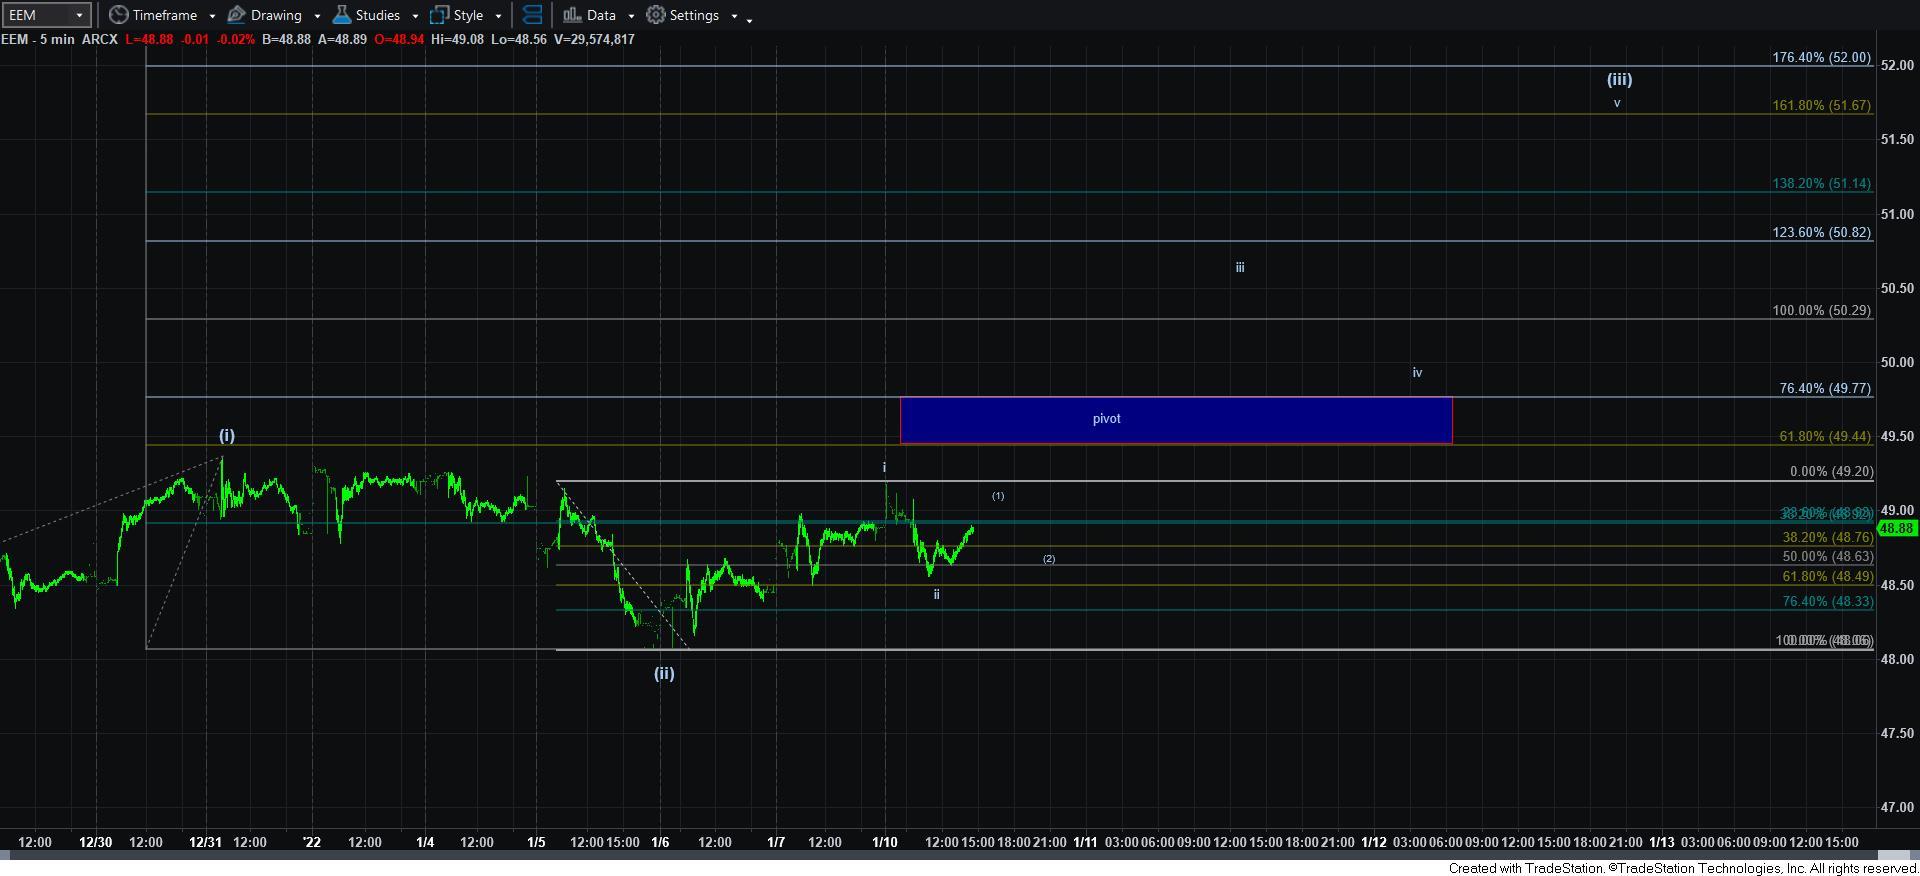
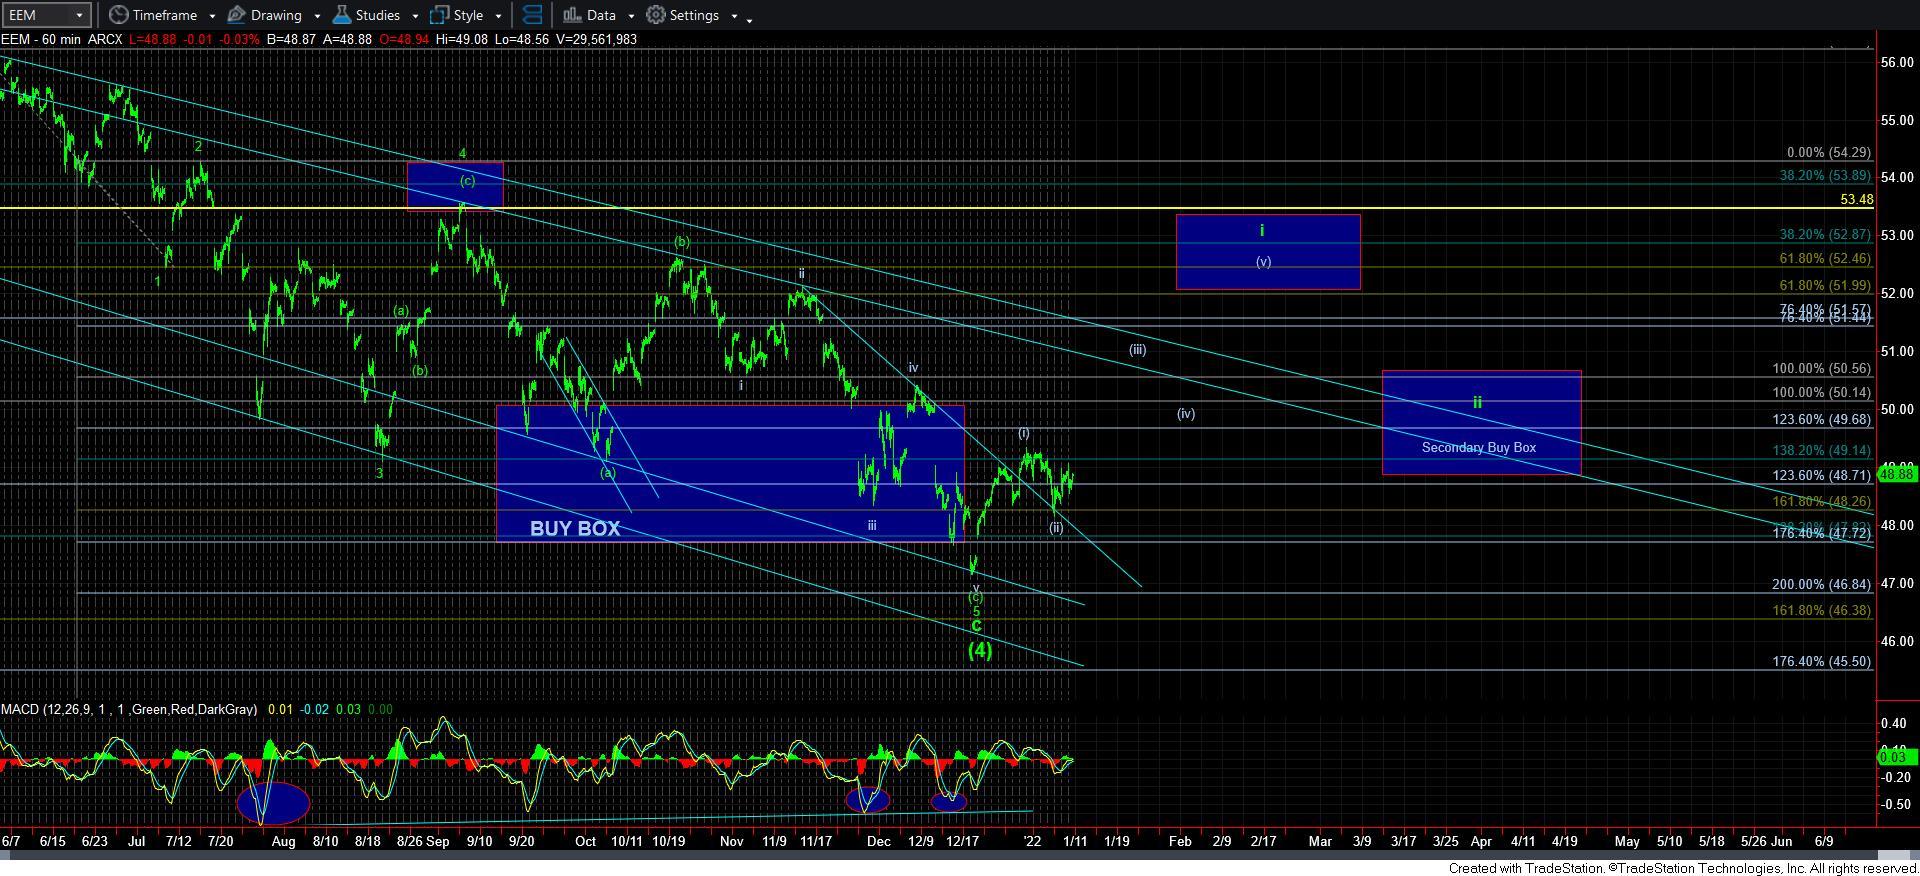
As a side note, the one chart that has been forcing me to maintain a bullish eye for further rally in the coming weeks is the EEM. We have the potential of a series of 1’s and 2’s off the low in EEM, and if this triggers to the upside, it will likely signal the potential for at least a week or two of risk-on action. But, if you are trading this to the upside, if we get to the [iii], you may want to lighten up on your positions, and allow the market to complete waves [iv] and [v], as you can then always buy back on the wave ii pullback.
Have a good evening all, and just prepare for what may still be more difficult action in the SPX in the coming weeks. But, ultimately, I still think we have a date with the 4400-4500 region for wave [4].