The Word For The Spring Is “Patience”
In late 2021, I began preparing you for what I expected to be a relatively long wave [4] pullback in the market. I expected it to take at least 2 months, and outlined how it would likely be the biggest pullback we see since we bottomed in March of 2020. In fact, I even warned you that by the time it was done, there would be ubiquitous agreement that the bull market had ended. And, that is pretty much what we have seen.
As we broke down below the 4400SPX region, I began hammering home that the upside potential was quite significant relative to the downside risk, which suggested that it was a good buying opportunity. But, as we now hover around the are approaching the 4500SPX region, I now view the risk/reward of buying a bit differently. But, I will get to that later in the update.
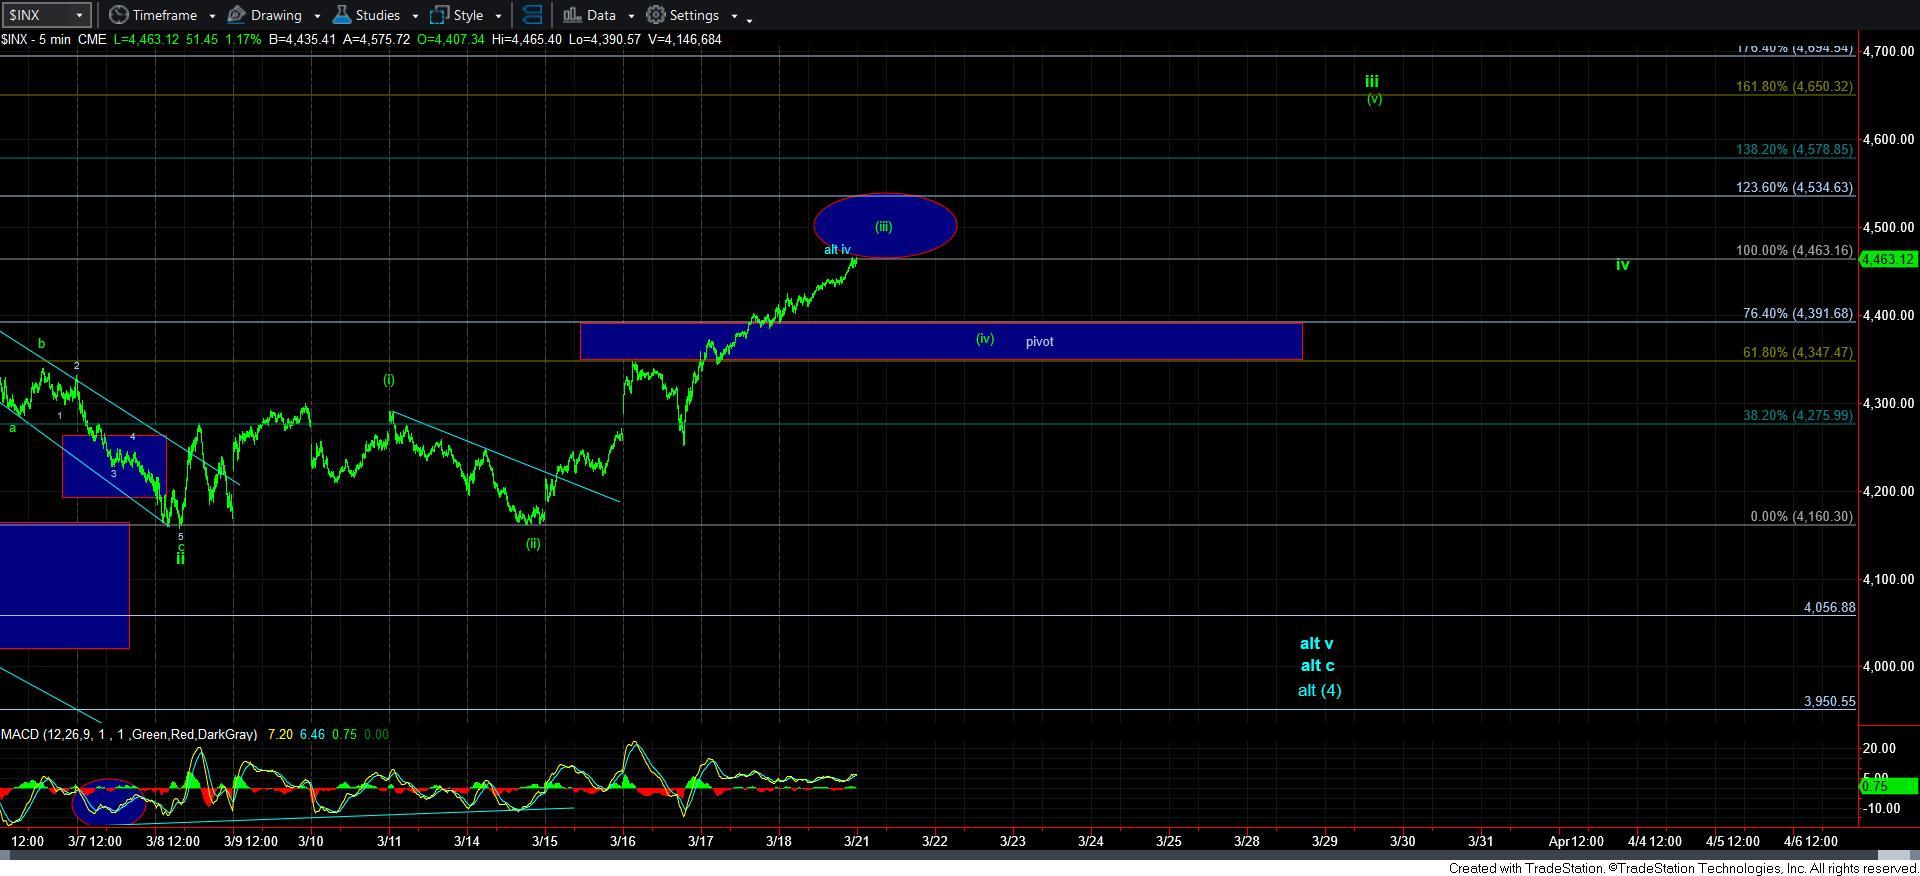
We have now travelled 350 points off the low struck the day that Russia invaded Ukraine. Yes, you heard me right. That invasion marked the bottom we struck on February 24th. And, we have now struck the 1.00 extension off the low in the SPX, which resides at 4463SPX. In fact, that is eerily where we closed the week.
As you can see on my charts, that 1.00 extension can represent the standard minimum target for the green wave [iii] of iii of 1, or it can be a c-wave within the blue a-b-c wave iv structure. My preference is clearly the green wave count. You see, when we normally see a corrective a-b-c rally, the c-wave will normally negatively diverge from the high struck in the a-wave (assuming it was not begun from an extreme oversold low in the MACD). In this case, this rally leg has clearly exceeded the high of what would have been an a-wave, making this rally much less likely as a c-wave. Therefore, we are acting much more like the heart of a 3rd wave, which is what the green count represents.
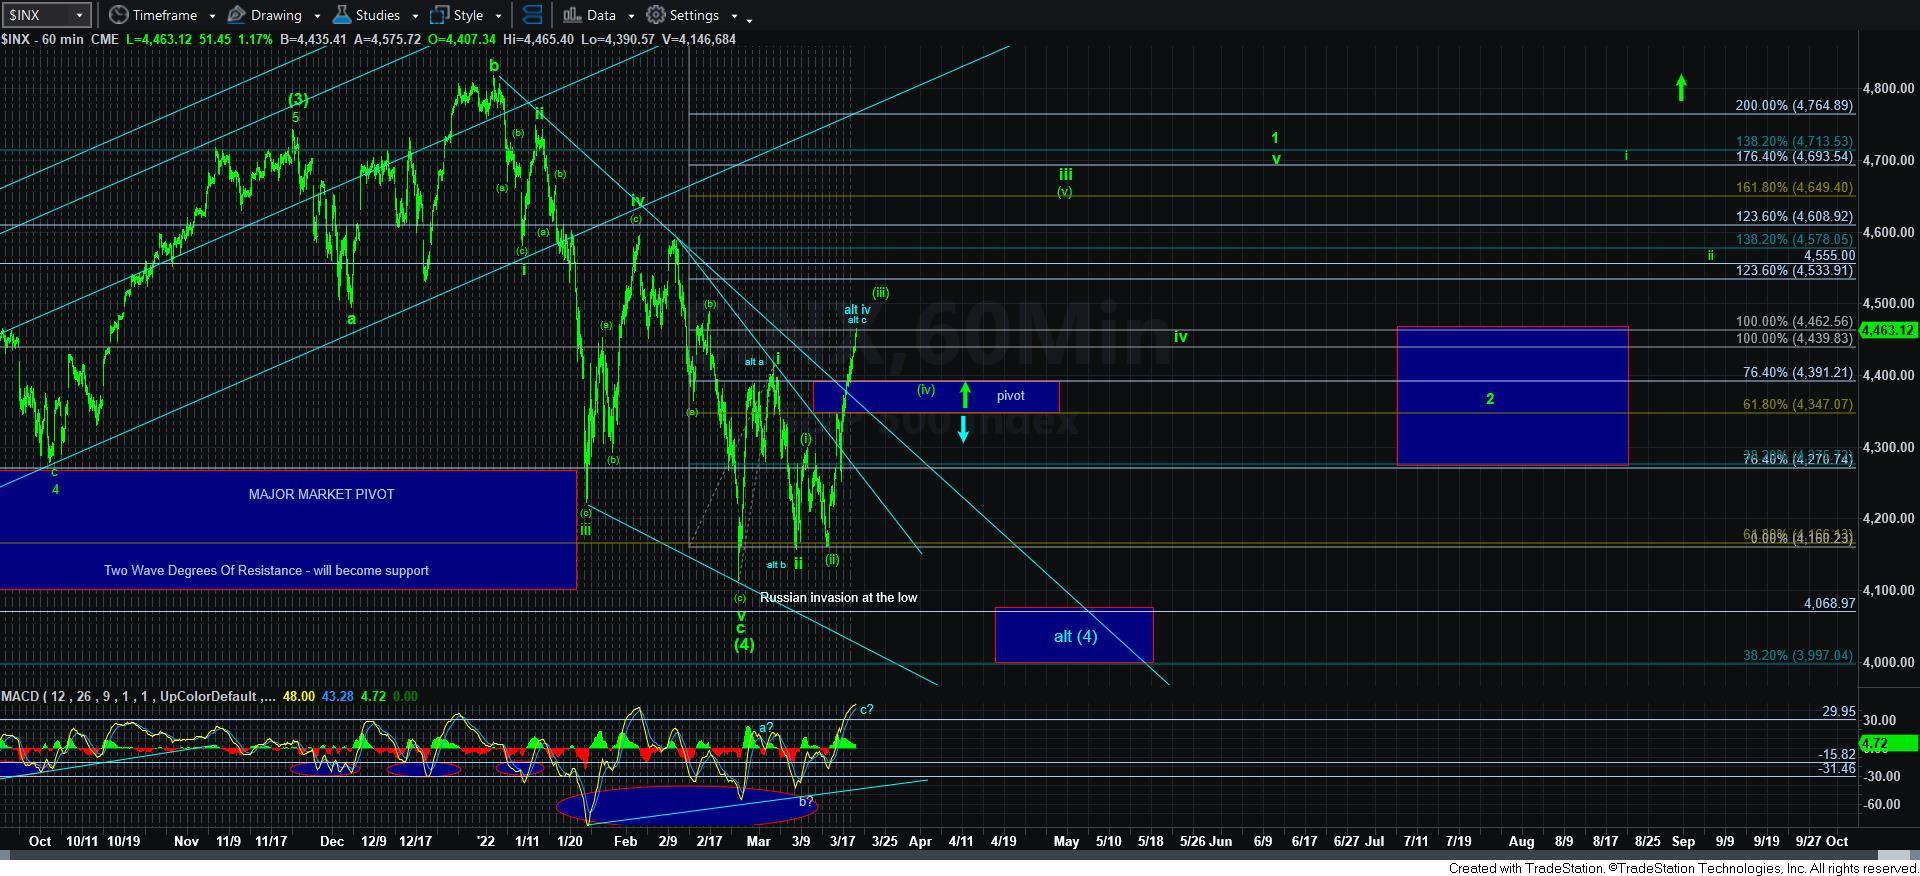
Since this is more likely wave [iii] within wave iii, it would suggest that we can still move a bit higher early in the coming week, but we will likely see a pullback that will test the pivot from which we just broke out this past week. Remember, based upon our Fibonacci Pinball structure (which has provided us exceptional guidance in this bull market for many years), wave [iii] of iii will target the 1.00-1.236 extension of waves i-ii, and then pullback to the .618-.764 extensions of waves i-ii within its wave [iv] (which I outlined as our pivot). As long as this support region holds in a corrective pullback for wave [iv], the rally should then continue on to the 1.382-1.618 extensions, which is the 4578-4650SPX region. You can see this most clearly on the 60-minute SPX chart.
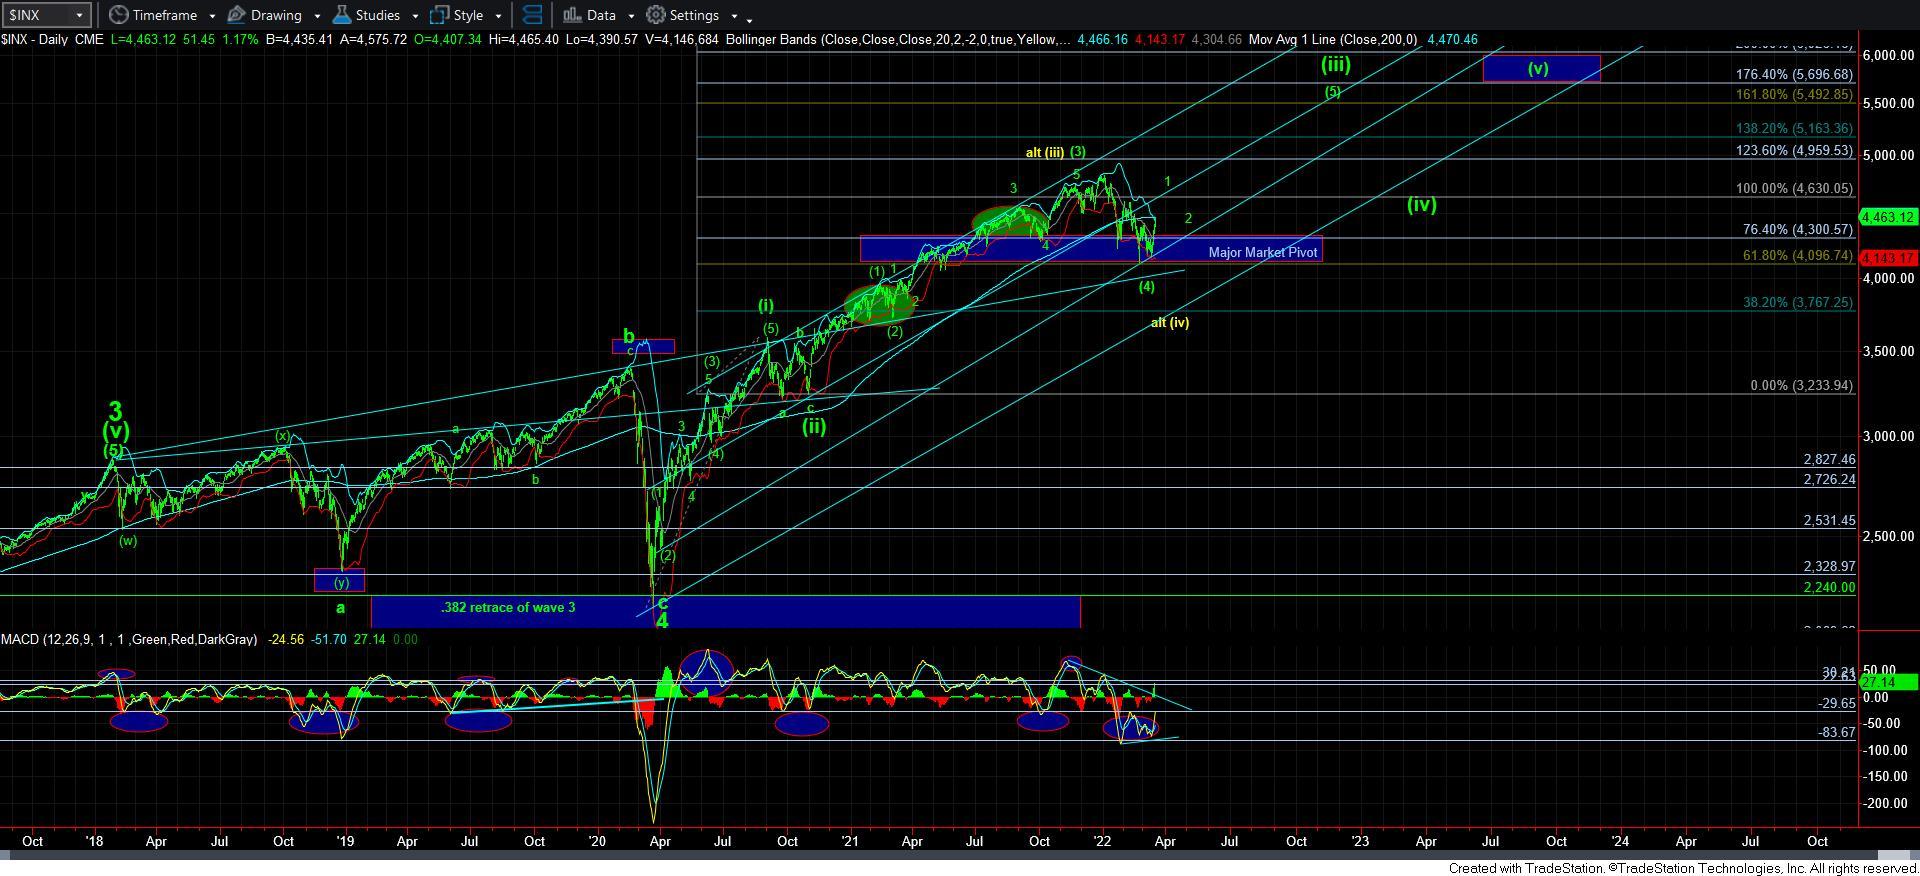
The other point I want to make is based upon the MACD on the daily chart. Not only did we get the appropriate positive divergence I have been highlighting as we were bottoming in the SPX, the MACD has now broken out to the upside in what mirrors the histogram action we experienced during the start of the October 2021 rally off support. This is another confirmation of the strength of this rally.
So, this makes our analysis quite simple for the coming week. I am expecting the market to top out in wave [iii] of iii, and then pullback correctively to our pivot. At this time, my expectation is that the pivot will hold as support, and set up our next rally higher in wave [v] of iii.
Now, I entitled this update as I did is for a specific reason. Many will now likely begin to be stricken by FOMO (fear of missing out). And, I am going to warn you not to allow yourself to be stricken as well. If you have been following my analysis over the last several months, you would know that I suggested members raise cash near the market highs, and then begin to deploy that cash into new long positions once we broke down below 4400SPX. I continually outlined that we had over 1000 points of potential upside, whereas the downside potential was likely only several hundred points. Therefore, layering into long positions was the prudent thing to do, despite how bearish everyone felt at the time.
Now, admittedly, I personally left a little bit of cash on the side in the event that we did see the lower low in the blue alt [4] scenario. Yes, I know that I gambled, and may have lost on that gamble. But, as I noted, it was with a small percentage of the cash that I had raised. Yet, it does not mean that this is the ideal time to deploy that cash. You see, there is still some potential that we can see that lower low, at least until we complete 5 waves up for all of wave 1. But, if we do complete all of wave 1, then we will likely see a wave 2 that takes us generally into the blue box on the right side of the 60-minute SPX chart. So, based upon these standards, it may be worth it to wait to deploy that last bit of cash until the completion of waves 1 and 2.
So, for now, our word for the spring is going to be “patience.” After positioning ourselves really well for the next major rally I expect, we can afford to have some patience until the market completes its waves 1 and 2. And, as you can see, it will likely take us into the summer-time to do so. Thereafter, we still need to complete waves i-ii of wave 3 before we are prepared to see a break out in the 3rd wave taking us to new market highs. So, it will not likely be until the latter segment of the summer, or even the early fall time frame until we see our next major break out. So, again, we can now afford to have some patience to allow the market to set up that break out structure.
(Note: My apologies, but I am still trying to get ready for my international trip beginning tomorrow morning. So, the metals and USO updates will be posted tomorrow).