The Whipsaw Continues
I am not sure how many times I have warned people about the environment we are now within, yet many still get surprised when the market whipsaws investors. Folks, please accept that this whipsaw will likely continue for some time, especially if we are forced to deal with a triangle for the next few months.
But, the main perspective you have to take from our analysis is that the market has more room to the downside in the larger degree over the coming year than it does on the upside. That means that even if the market can follow through to as high as 3000 (not highly likely at the moment), the downside potential is double of any upside from right here. So, when you review the risk/reward analysis, I strongly urge you to consider this perspective.
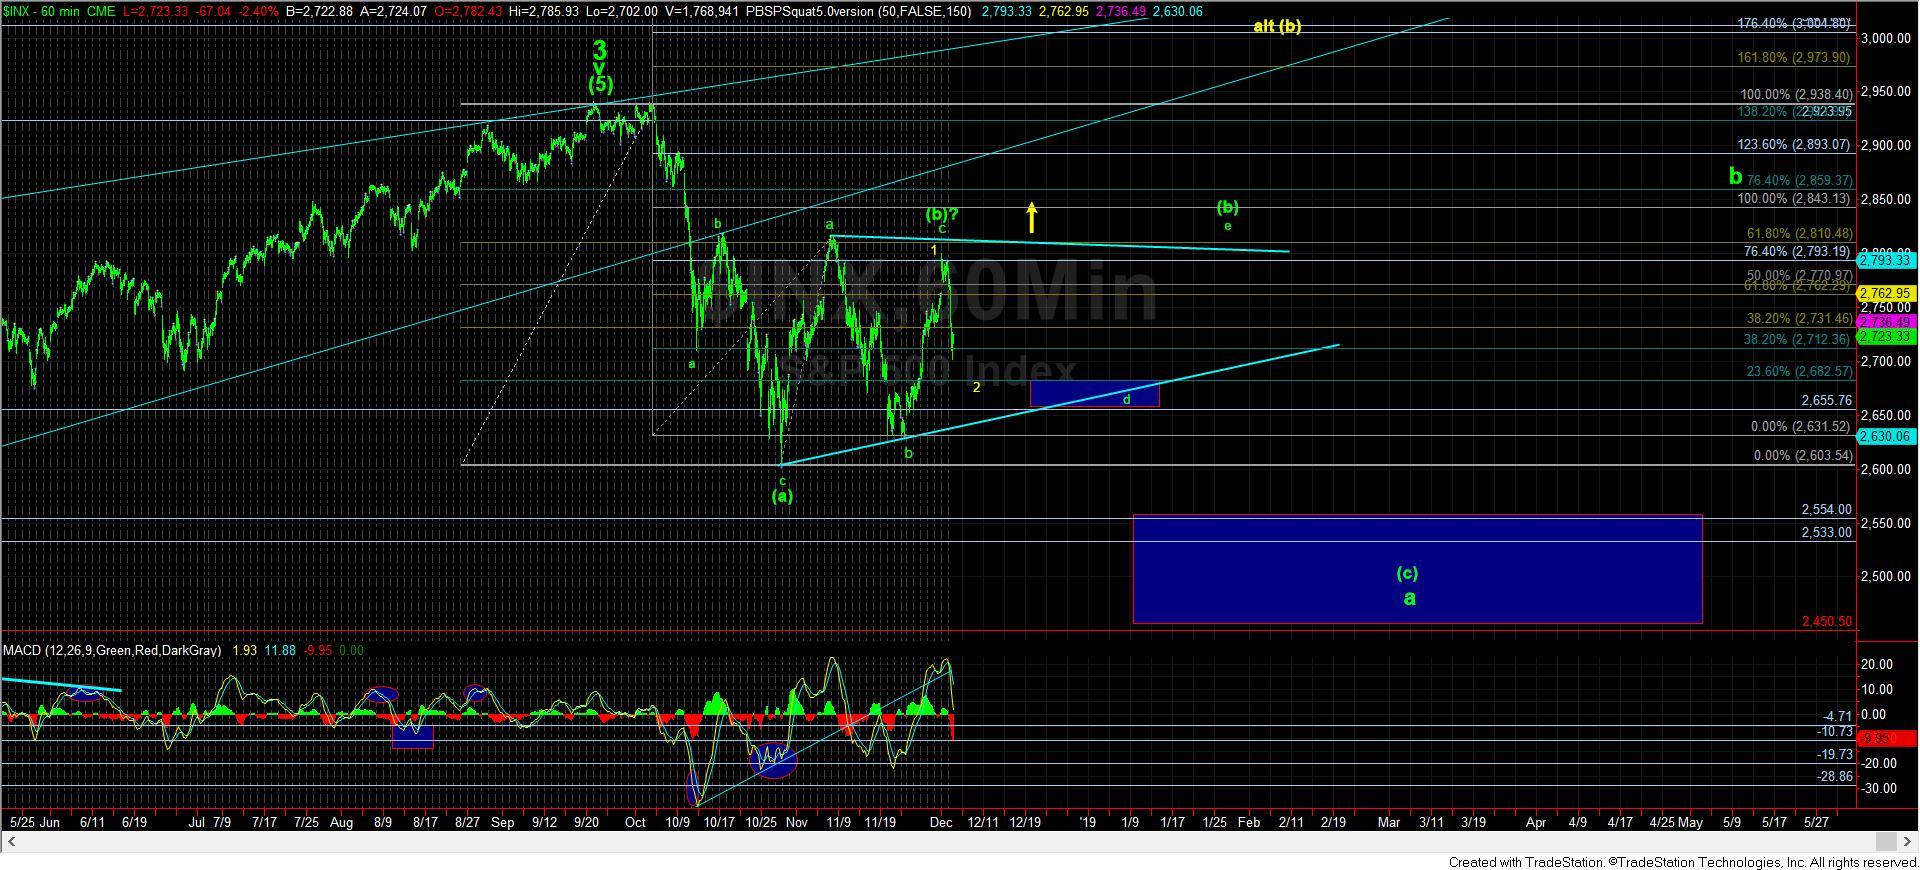
As far as we are now in the progression of patterns I provided this week, it would seem the triangle has gained probabilities. Yet, as I am writing this update, the market is dangerously close to completing 5 waves down off the high struck this week. Should we be able to complete 5 waves down from this week’s high, that would place me on red alert for a decline to the 2500 region sooner rather than later. In fact, the ideal target for the (c) of a-wave on the 60 minute chart is just below the 2500 region.
But, the reason I choose to even present the triangle potential is because of the proportions in the decline seen from the high in early in November down to the 2630 region. That presented us with a c=.764*a proportion, and that is most commonly seen within the first leg of a triangle. And, now that we topped below that high so far, this has strengthened the potential for a triangle for this (b) wave.
As I noted in my live video this morning, the interesting thing about triangles is that they have at least one leg that is quite complex. Most often, we see it in the c-wave. But, this c-wave – if this is indeed a triangle – was rather straight forward. And, it is very rare that an e-wave would be the complex structure. That means that this d-wave would likely be the complex structure, and it could take us a full month to even complete just that d-wave. Yet, with the size of this initial decline today, it does put questions in our mind for now. However, so far, the larger proportions we have seen really fit quite well within the triangle count I presented last week.
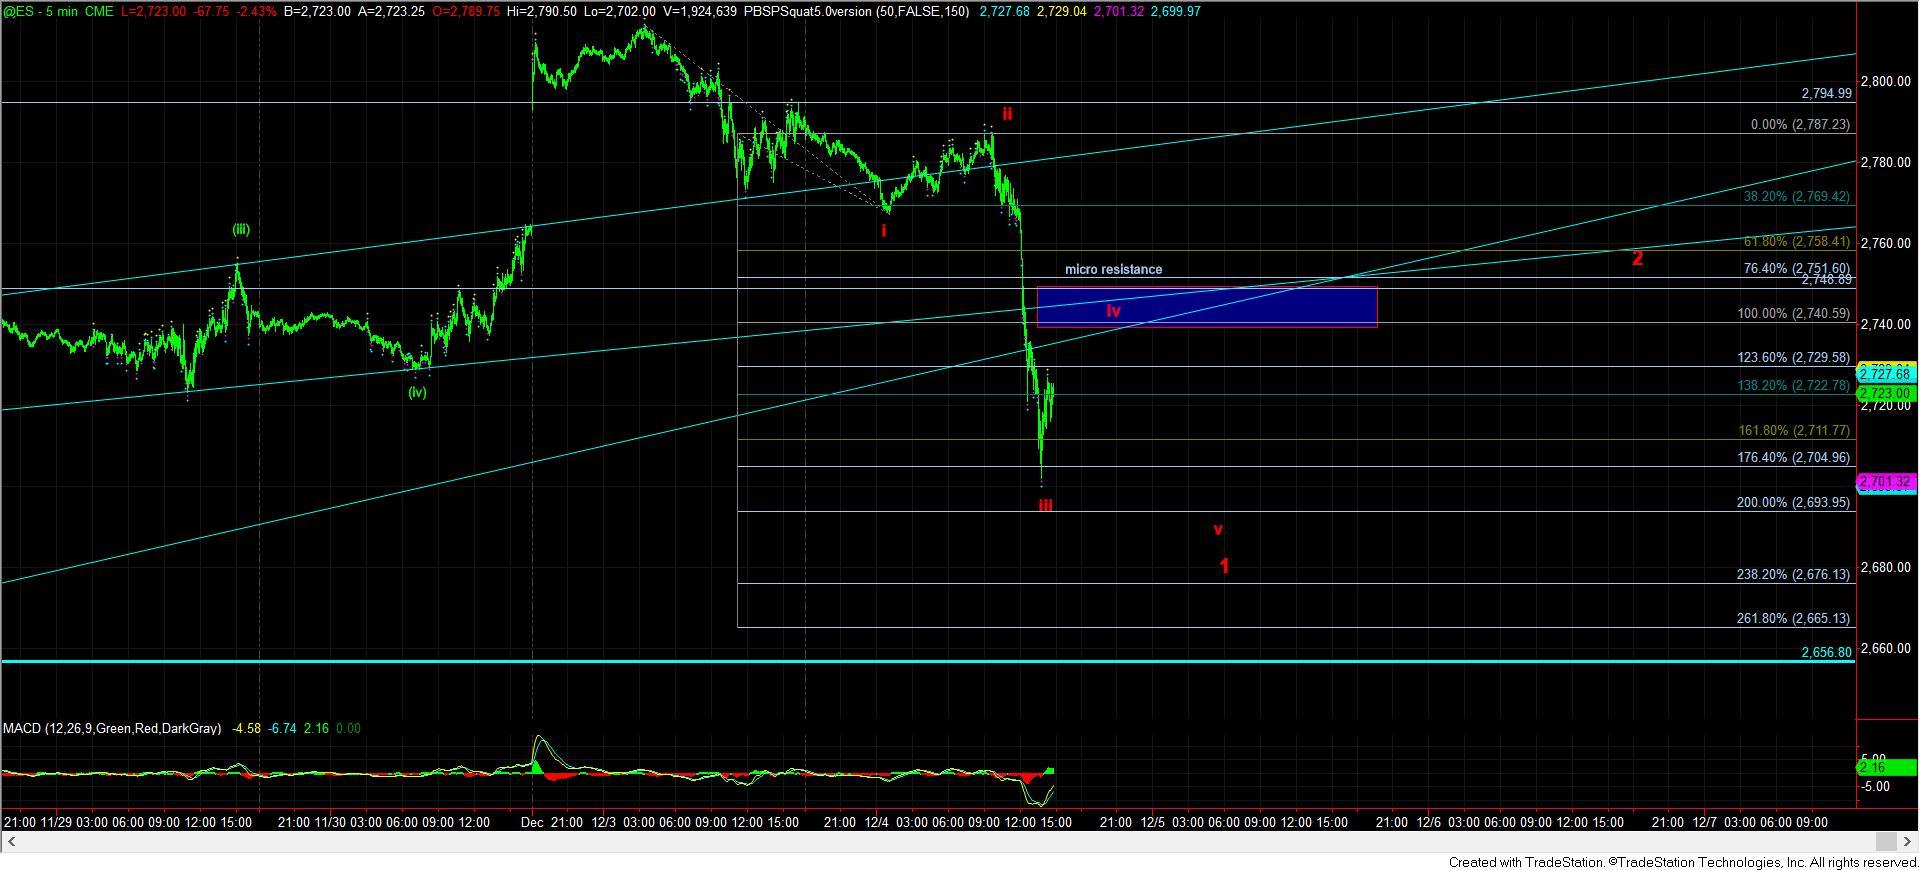
Yet, as I noted above, we will need to see the ES move through the 2740-50 resistance region before it completes 5 waves down, as shown on the attached 5-minute chart. Should we complete 5 down before we move through 2750, then it will put me on red alert for a downside set up to 2450-2500. So, I labeled the 1-2 downside set up in red on the 5-minute chart.
But, moving through the 2750 region would suggest that the triangle is the more likely count to follow.
Yet, as I have highlighted so many times in the past, when the market does not strike its long term targets before it begins a correction, we often see a b-wave come back to strike the target we missed. In our case, that is the 3011 region of which we came up short.
This brings me to the yellow count on my chart. Right now, I view it is as VERY low probability. And, as long as we remain below the 2813ES high we struck this week, I maintain that perspective. However, if the market is able to move through that region in an impulsive structure, then I have to be open to the potential for that yellow count to point us to the 3000 region in the yellow (b) wave.
In summary, as long as the market remains below the 2813ES resistance struck this week, I am going to allow the market to set up the decline to the 2450-2500 region next. Whether that takes shape with the triangle filling out first for this more protracted (b) wave over the next few months, or whether it is more direct by remaining below 2750 and completing 5 waves down is yet to be determined. But, should we see a strong move through this weeks high, please maintain an open mind that there may still be some strength left in this bull before we start subdividing down to the 2500 region.