The Structure Of The Next Pullback Will Be Key
 By
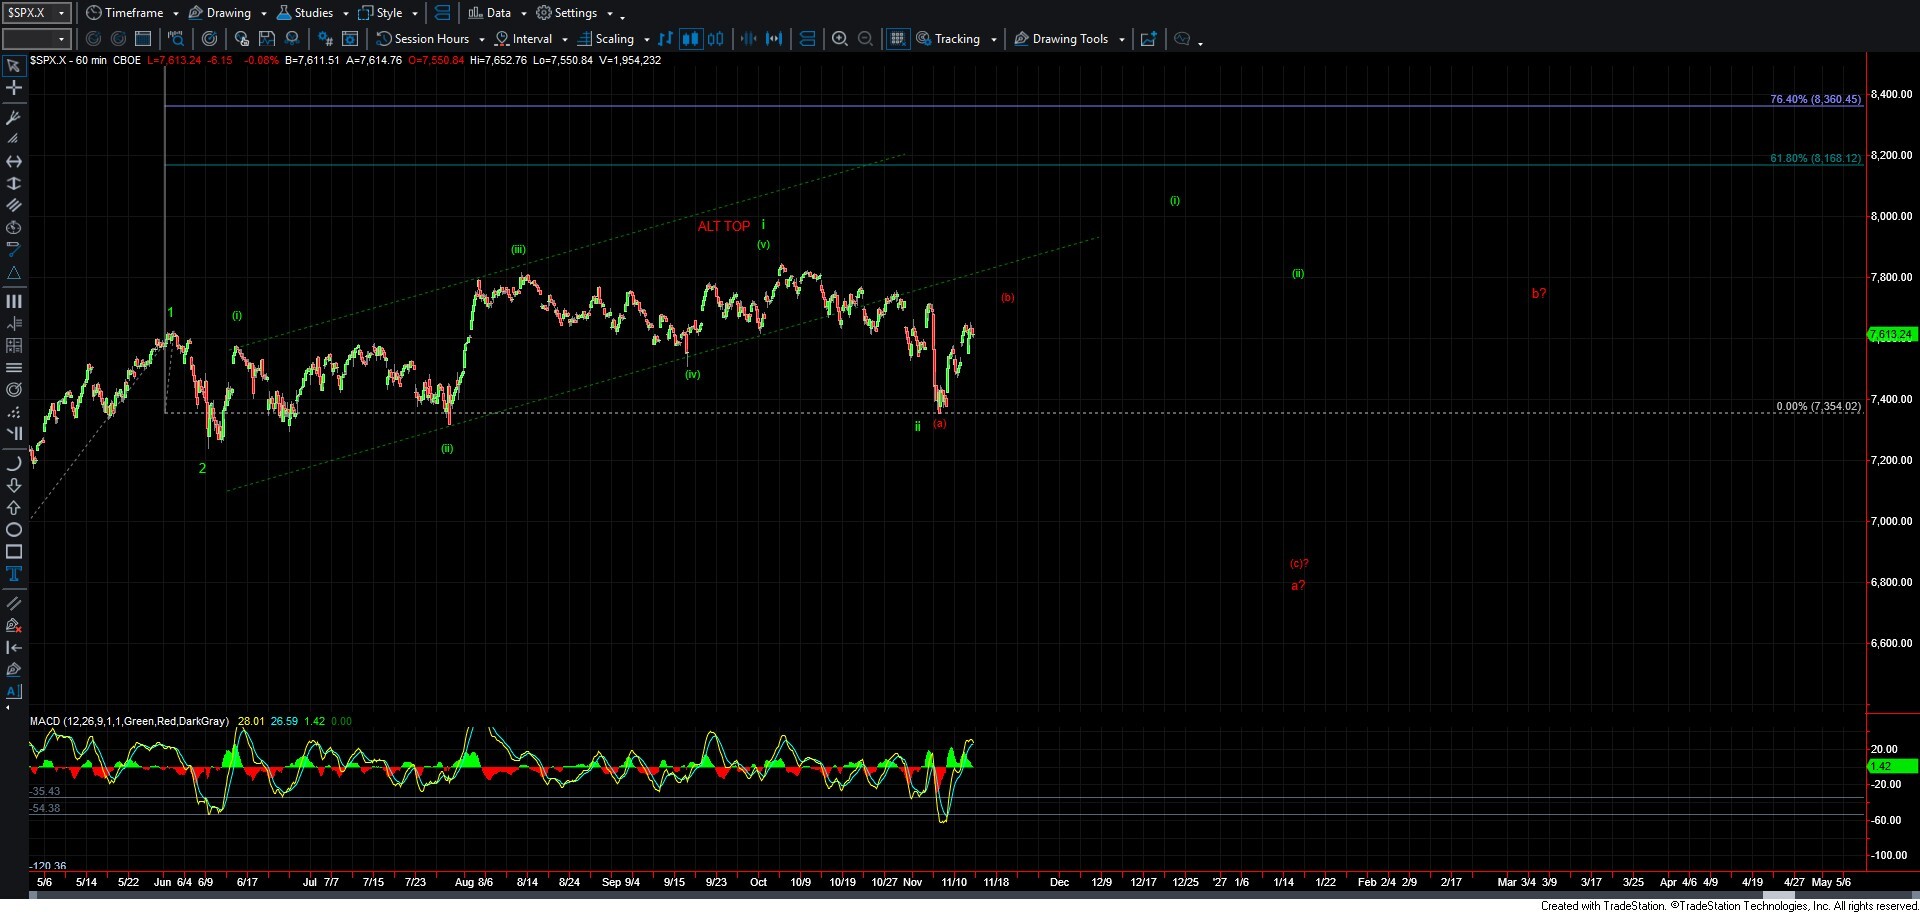
The wave structure of the move up off of the November 5th low is far from clean, and it could reasonably be counted as either a five- or three-wave move. This is making it much more difficult to say with a high degree of certainty whether that low was the bottom of the green wave ii or simply the start of a larger corrective move lower. So, with that, we are going to need to wait for the market to provide us with a bit more evidence during the next move lower, where we can better identify the structure of that move. Once we see the structure of that move lower, we will be better able to identify if the market has intentions to push back to new highs or if we will still see lower levels ahead.
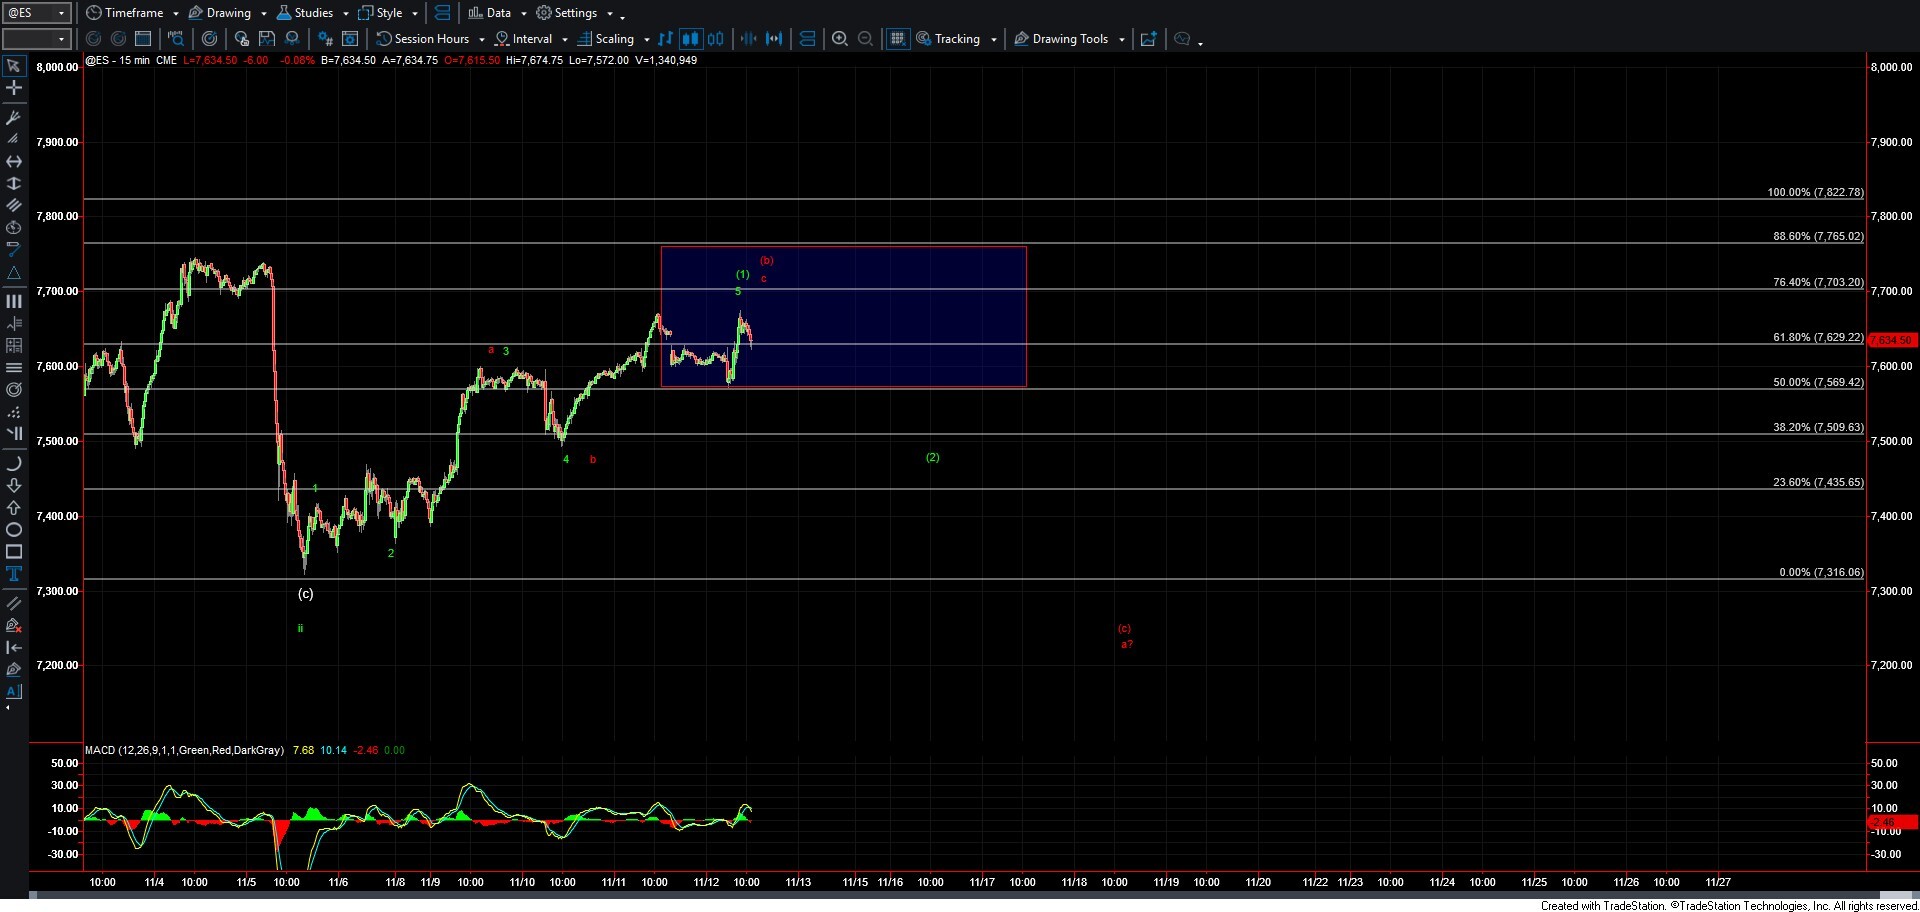
As shown on the ES chart, we are currently trading in the standard retracement zone for the potential wave (b) per the red count. If we hold this zone and turn back under the 7569 level, then it will give us initial confirmation that we have indeed made a local top. From there, we will need to keep a very close eye on the structure of the next move lower to help identify if the green or red count is the more likely path forward.
If we move lower in five waves, then it will open the door for further downside follow-through as part of the wave (c) back under the 7316 level. If the move lower is corrective in nature, then it would suggest that we are indeed following the green count and the market has intentions to push higher in the weeks and months ahead.
For now, however, the market is in a bit of no-man's-land and is not providing us with a clear distinction between the two paths. So, with that, I will remain patient in this region and wait for the market to give us more information to help us better identify which path will indeed end up being the operative path forward.