The Push Higher Has Not Changed The Overall Perspective
 By
By
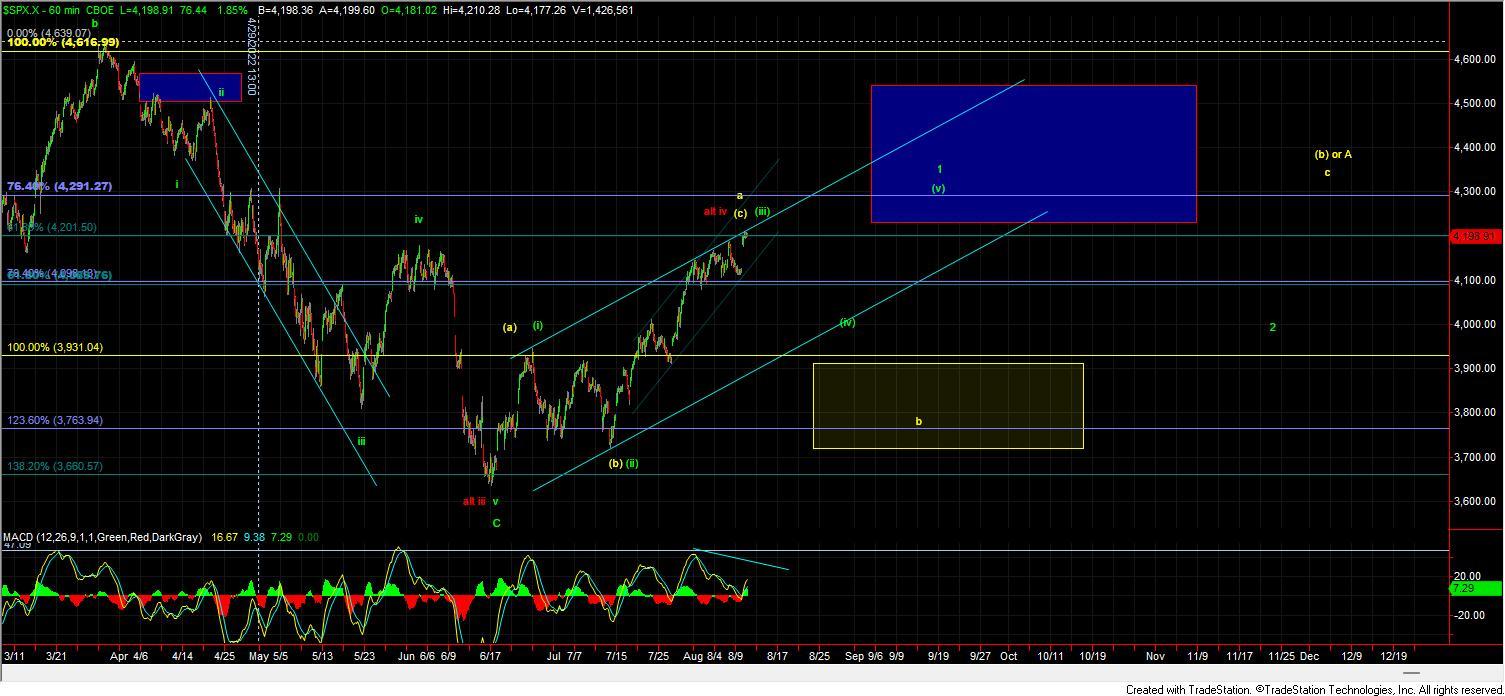
This morning before the regular market opened we saw the indexes move sharply higher with the ES and eventually the RTY pushing to new highs over the highs that were struck on Monday. The NQ is still lagging a bit behind and as of this writing is still trading just under Monday's high. The potential to see this push higher on the smaller degree timeframes was left on the board yesterday at the close as the market had yet to either break upper support or develop a full five wave move to the downside. For that reason, I noted that the market still had work to do to confirm a top in the headline of yesterday's update. With that being said and although we have pushed to a new nominal micro higher high the outlook for the bigger picture path as laid out on the 60min chart has remained unchanged. While we still yet to have confirmation that a local top is indeed in place the odds of seeing the market pullback from this region still are favored, however as I noted yesterday and will reiterate today, we need to see a break of the upper support zone or a full five down off of the highs before we have confirmation that a local top has indeed been struck. Once that top is struck due to the overlapping nature of the move up off at least the 4078 level I would expect the initial move to be quite sharp back down towards that level with a break of that level then giving us the signal that the larger degree top has indeed been struck.
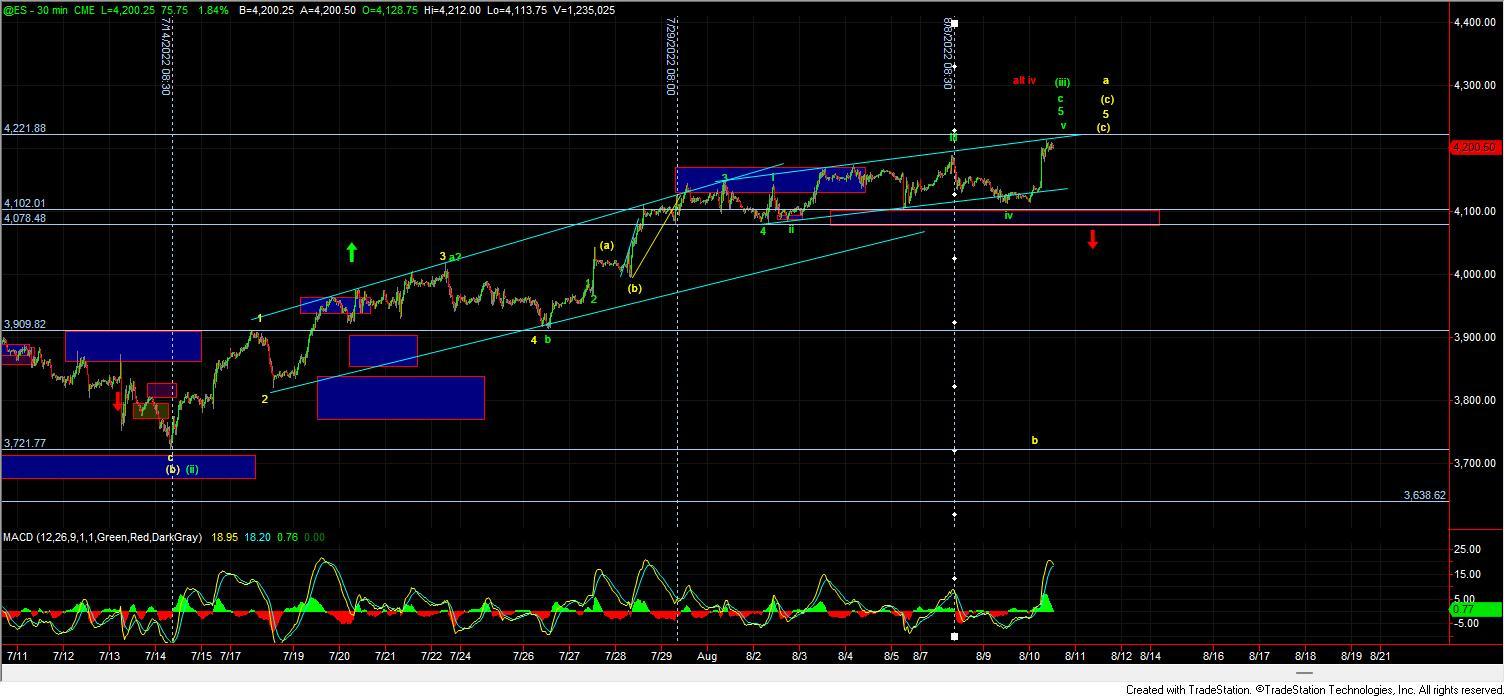
On the smaller degree timeframes (under both yellow and green) I am counting this push higher as part of the wave v which I had shown as an alternate on yesterday's ES chart. ideally, I would prefer to see this hold the upper Trend Line of the channel if we are indeed following the ending diagonal up off of the 4078 low. Depending on the timing of any push higher that would likely mean we ideally would hold anywhere from current levels up towards the 4220ish region. With that being said because the wave iv of the same degree did breach the lower trend channel slidingly it would not be uncommon to see an overthrow on the upper end of the trend channel as well for the wave v. So there is a little bit of flexibility we can give this even this were to breach the upper trend line of the channel. The pivot and support level below remains unchanged for now and I still would want to see a break of the 4102-4078 zone below to give us the initial signal that a top is indeed in place. A break of this support zone would signal a top for either the yellow or green counts and again we would need to see the depth of the next push lower upon a top to help give better guidance as to which of the two paths we are following as we move lower.
Yellow Count
As noted previously the yellow count would suggest that we are following an ABC up off of the June lows with the wave (c) of that ABC coming into completion near current levels in the form of an ending diagonal. As it is typical for the reversal out of an Ending Diagonal to be quite sharp back to the origination point if we are indeed following this yellow count I would expect to see a sharp move lower that ultimately targets the 3736 level below. I would want to see this move below the 3994 level followed by a break under the 3900 level to give us confirmation that we have indeed topped in this yellow count. Again this should be a fairly swift reversal to the downside under this yellow count so If we do break under the 3994 level but see a more muted move down then I think it would become more probable that we are following the green wave (iv) retrace.
Green Count
Under the green count, we still should see a pullback towards the 3950-3900 region and that pullback should take the form of a three-wave move. We should however see another higher high back over the current high to complete a potential leading diagonal up off of the lows. The initial move down off of the highs will likely be very similar to that of the yellow count but again the drop will not be nearly as sharp or deep before turning higher once again. Additionally, once this does bottom in the wave (iv) the final leg up for the wave (v) of 1 is likely going to give us more sloppy action as it should take the form of another three-wave move to fill out the last leg of the leading diagonal.
This slow grind and push to new highs in what is still very overlapping fashion can be quite frustrating but unfortunately, this does still seem to be part of the same topping process that we have been dealing with for several weeks now. This pattern is still leaving a fair amount of risk to the immediate upside and a pullback down towards at least the 3950-3900 remains the base case with still the potential to see a deeper pullback per that yellow count. So with that, I still remain cautious here but until we see a break of support and/or a full five down off of the highs the market has yet further work to do to give us confirmation that a top is indeed in place.