The Pattern Is Getting Full To The Upside
 By
By
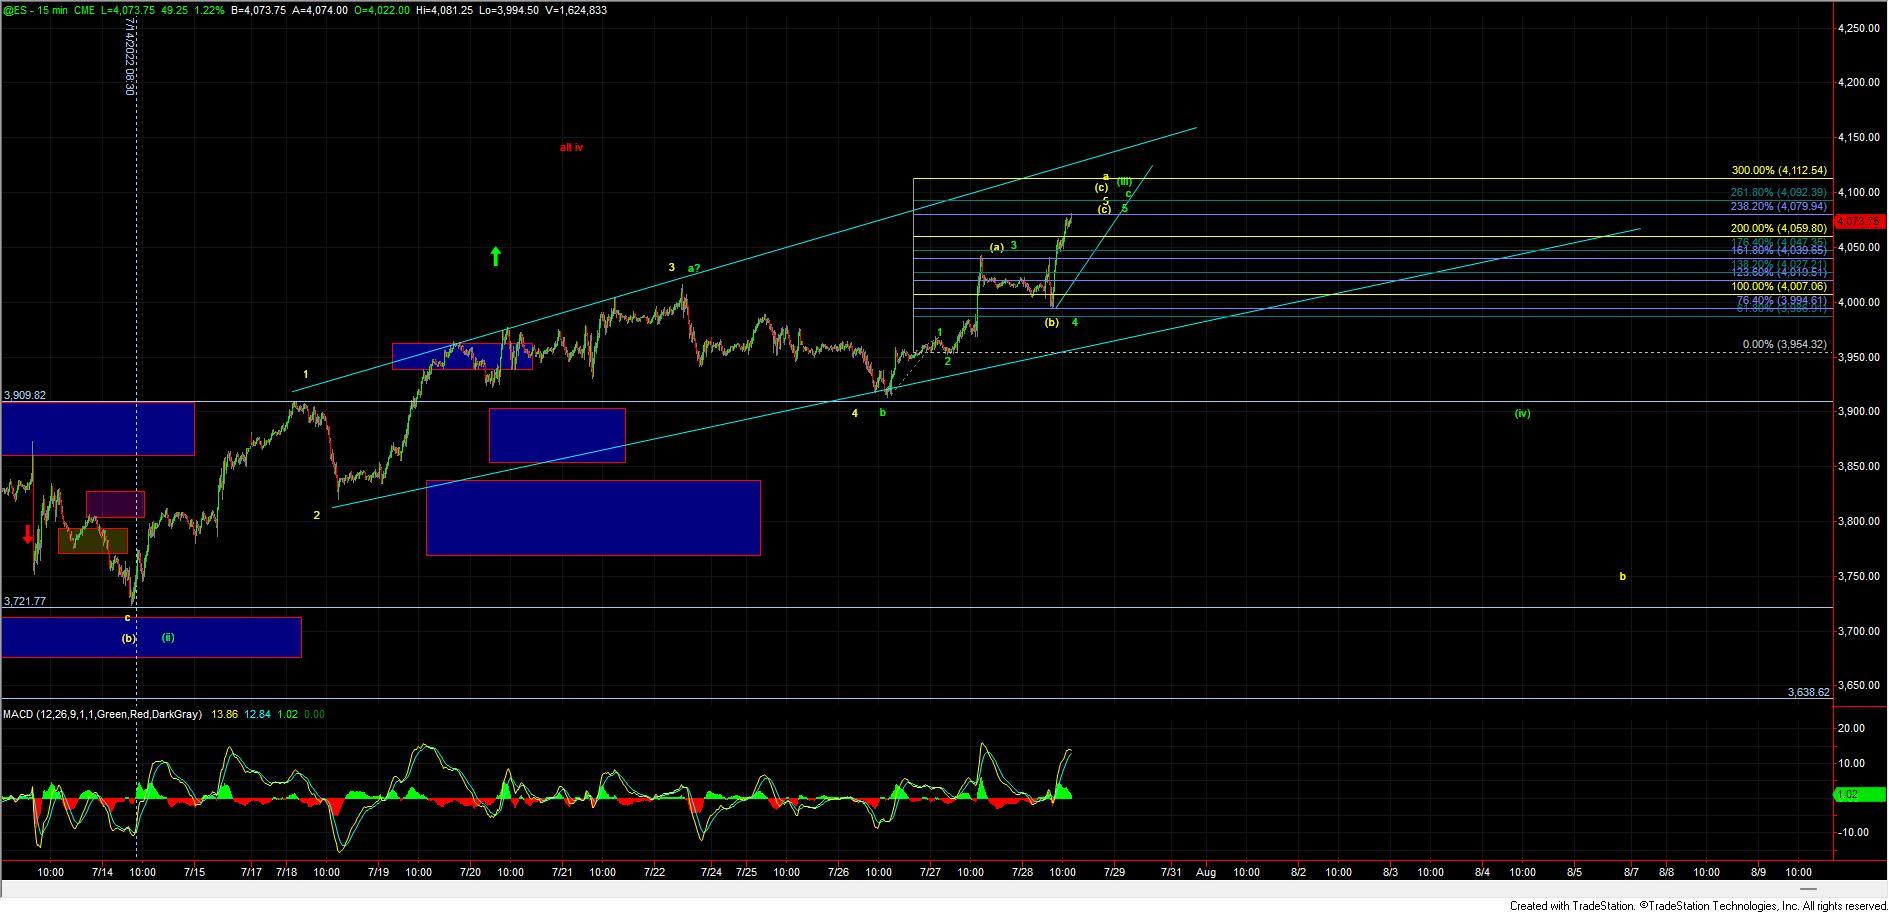
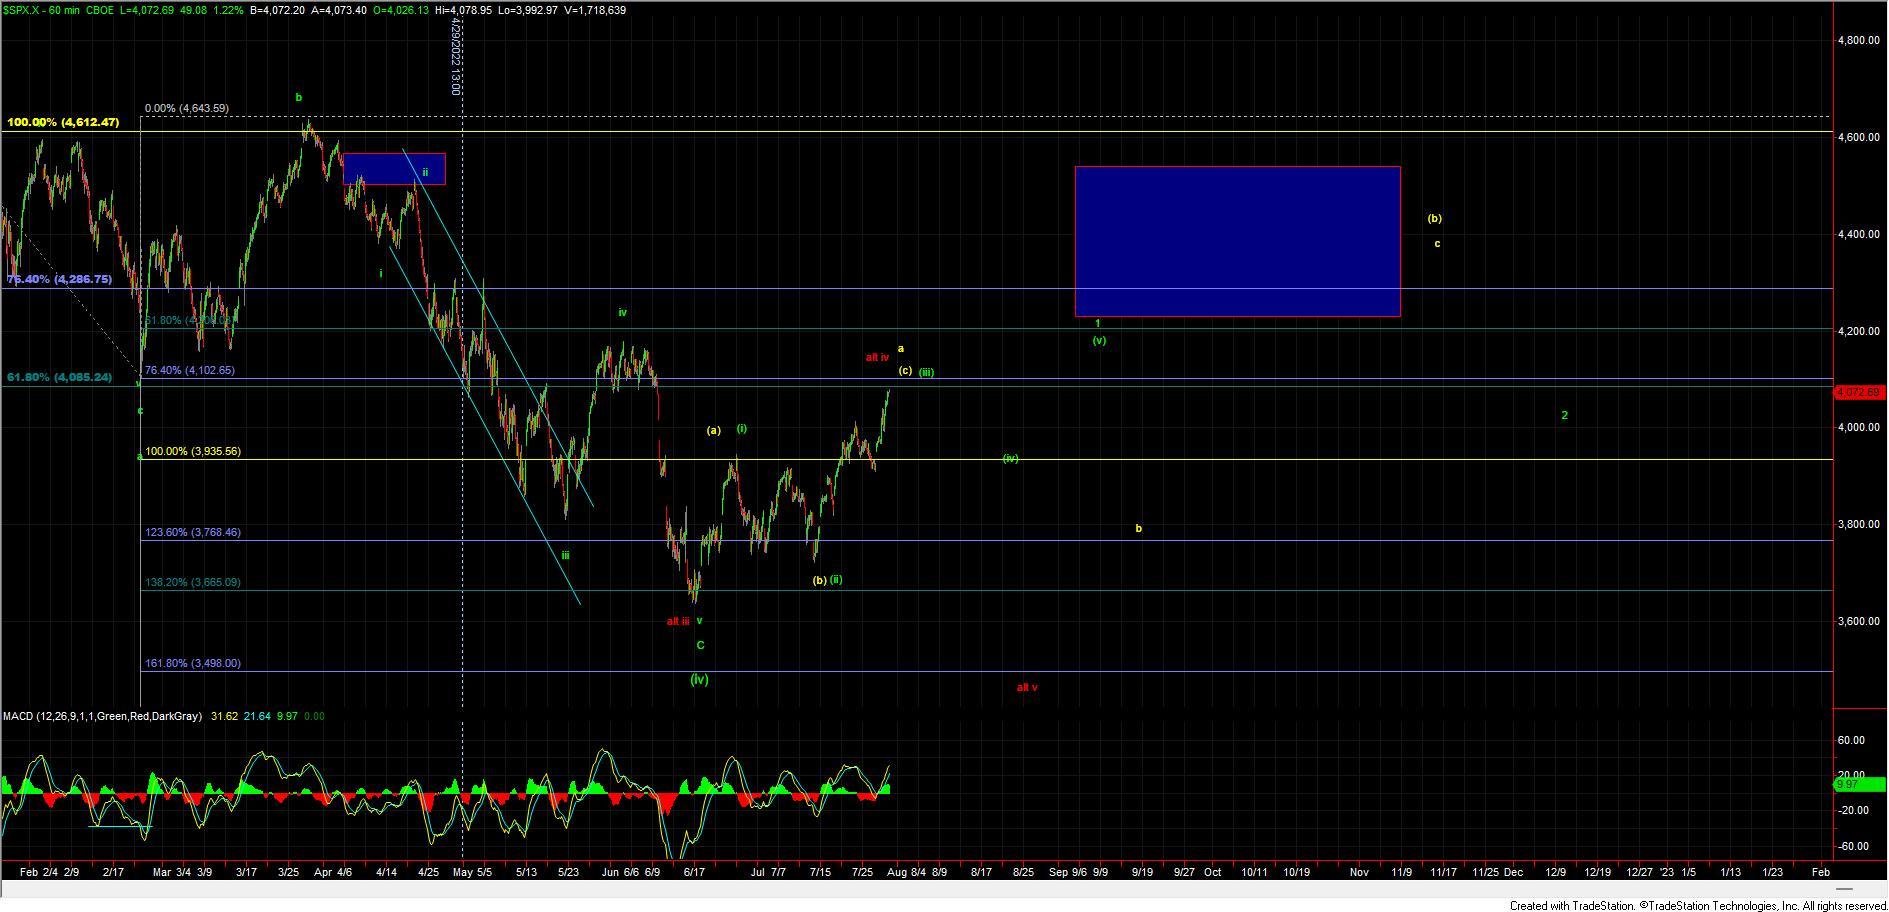
After seeing a sharp rally yesterday afternoon the market opened fairly flat having consolidated during most of the overnight session. After the open, the market did see a dip just under the ideal pivot/support level but quickly recovered and has since seen another strong rally into the end of the day and we are now closing in on that 4100 regions that Avi had laid out as the next major target region for the past several weeks. Furthermore, the pattern up into this region is getting quite full on all but the most micro of timeframes and we are heading into a region of larger degree overhead resistance. While we still can certainly extend higher as we do not have any confirmation of a local top just yet, with what can be considered a full pattern and overall corrective and sloppy action up off of the lows I still remain quite cautious to the upside here in the equity markets. We are still watching two different topping patterns as shown in green and yellow but in both cases, a pullback towards the 3900 area should be in the cards per the green count with the yellow count likely seeing a retrace closer to the 3700 region. I will do my best to lay out the parameters of these two paths below but keep in mind that they both will likely start out very similarly and we will simply have to watch both the pattern and price levels once we top to help give us further guidance s to which of the two patterns we are indeed following.
Yellow Count
I personally still prefer this count over the green count for a number of reasons but I will note that it is not a heavy favorite and I will certainly be open to the green count and let the price and pattern dictate which path we are indeed following once we do top. This yellow count would suggest that we are following an ABC up off of the June lows with the wave (c) of that ABC coming into completion near current levels in the form of an ending diagonal. As it is typical for the reversal out of an Ending Diagonal to be quite sharp back to the origination point if we are indeed following this yellow count I would expect to see a sharp move lower that ultimately targets the 3736 level below. I would want to see this move below the 3994 level followed by a break under the 3909 level to give us confirmation that we have indeed topped in this yellow count. Again this should be a fairly swift reversal to the downside under this yellow count so If we do break under the 3994 level but see a more muted move down then I think it would become more probable that we are following the green wave (iv) retrace.
Green Count
Under that green count, we still should see a pullback towards the 3900 region and that pullback should take the form of a three-wave move. We should however see another higher high back over the current high to complete a potential leading diagonal up off of the lows. The initial move down off of the highs will likely be very similar to that of the yellow count but again the drop will not be nearly as sharp or deep before turning higher once again. Additionally, once this does bottom in the wave (iv) the final leg up for the wave (v) of 1 is likely going to give us more sloppy action as it should take the form of another three wave move to fill out the last leg of the leading diagonal.
So while this is certainly moving in the direction that we had expected, and towards the target levels laid out, the action is still very sloppy. This of course is also not a surprise as sloppy action in this part of the diagonal pattern is to be expected. This will likely continue as we move into the rest of the summer so while there can certainly be some good trading to be had for those who are nimble this region still remains quite treachours and caution is still very much warranted for here until we can get to a point in which the pattern clears itself up and once again begins to follow impulsive wave action. In the meantime, we will continue to lay out the turning points, support, and resistance levels as we see them but please just bare in mind that there will be many twists and many turns on the smaller degree timeframes.