The Pattern Is Getting Full But Still No Signal Of A Local Top
 By
By
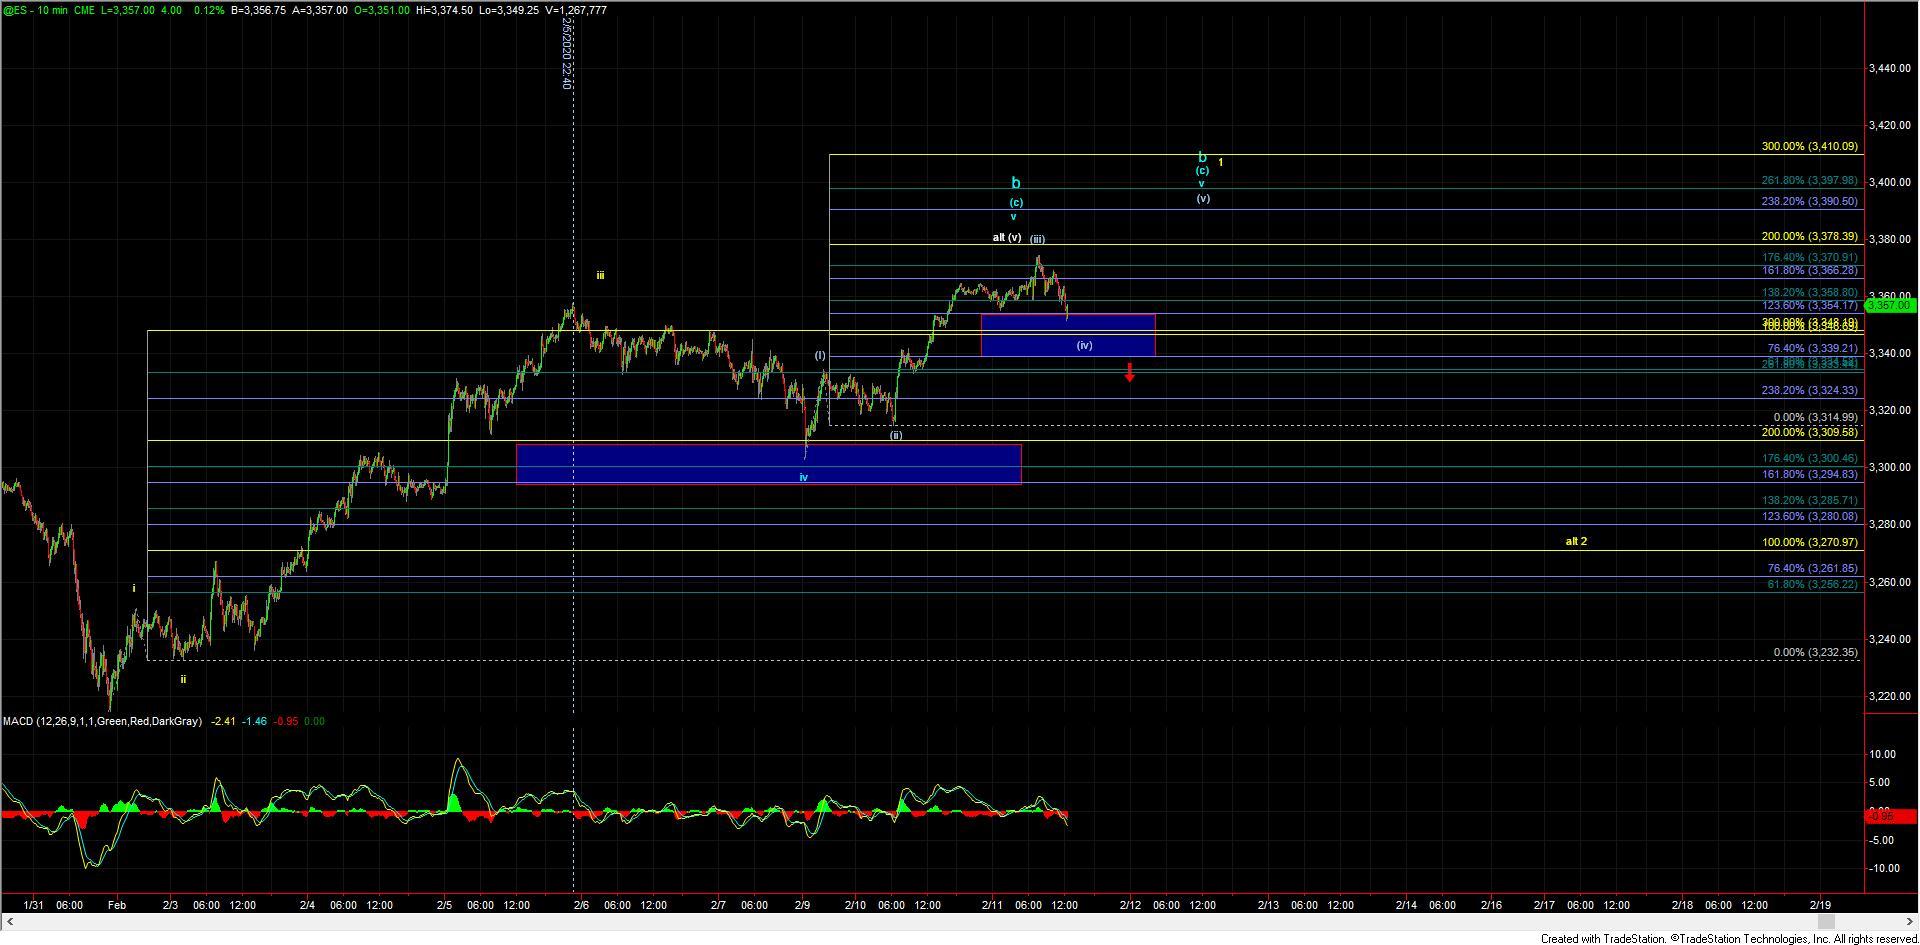
After opening higher and and hitting some micro upside resistance levels the SPX spent the afternoon retracing lower on the day. So far the action down off of the highs is only three waves and we are still trading over the micro support levels that I have been noting on the ES chart which currently come in at the 3354-3339 zone. So given that we are still over support and only have three waves down off of the highs there is still no signal that we have stuck even a local top just yet and until support is broken this still can push higher over today's HOD to give us a wave (v) of v up off of the 2/9 low. Should we see a break of that then it would provide us with an initial signal that we have indeed struck a local top. From that point we then would need to keep a close eye on the structure of the next move down to help determine if we are following the yellow or blue paths as laid out on the charts.
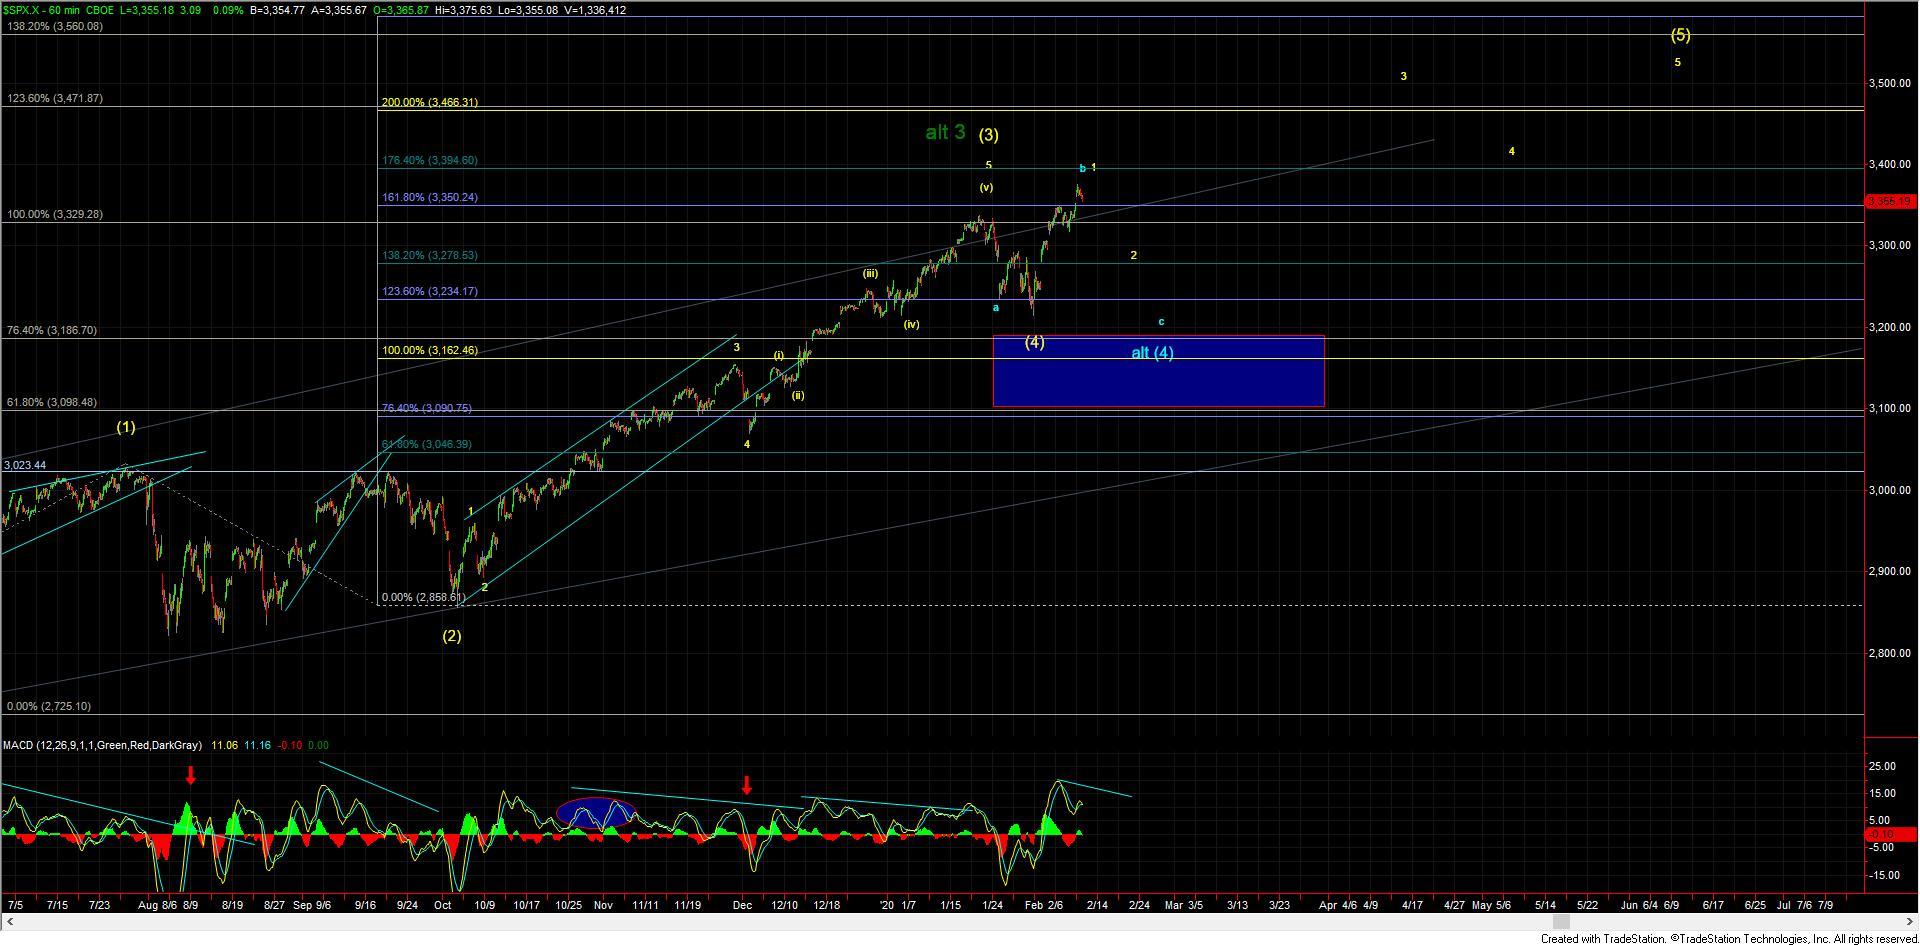
So while on the smaller time-frames we still do not have any signal of a local top just yet when zooming out to the 60m chart we are starting to form some larger degree negative divergence and we do have a fairly full pattern in place from the move up off of the January 31st low. So while we do still need some confirmation with a break of support we are starting to see some other signals that would suggest we are close to seeing a local top on the SPX.
Of course we still must not lose sight of where we are on this larger time-frame chart and as noted yesterday as long as we are over 3186-3090 zone we are still very much positioned to move higher over the course of the next several months. Moving below that larger degree support zone would then open the door to some more immediately bearish paths but for now and as long as that zone holds the path for the near term still is pointing higher. Both cases are still quite bullish as long as we remain over the larger degree support as shown on the 60min chart however the yellow path is simply a more direct and immediately bullish pattern that will see a much more shallow retrace before resuming the bullish trend.