The Next Pullback Will Be The Key
With the rally we experienced today, the market made it quite clear that the drop on Friday was complete, and we may very well have a bottom in place.
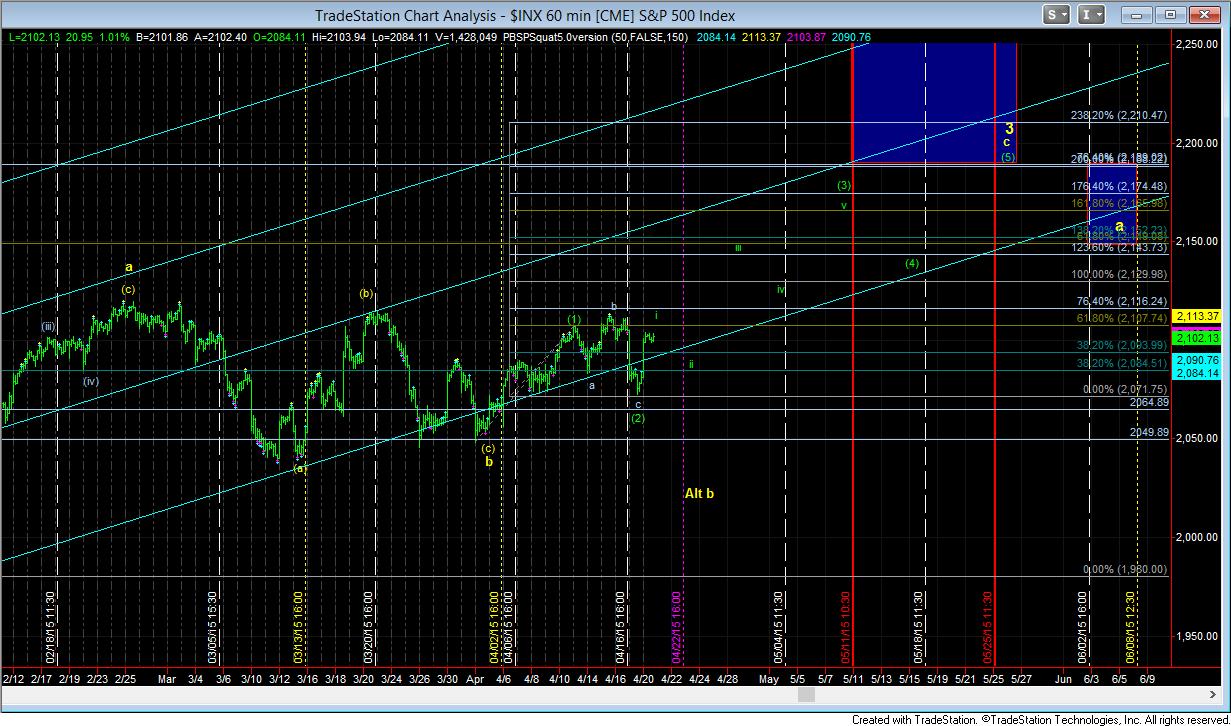
Throughout the day, I was posting alerts in the IWM, the SPX and the ES which showed you my line of thinking as to the potential in the market at this time. In the most bullish sense, I could have been quite wrong in expecting further weakness since the low may have been struck on Friday. I have this represented on the attached turn chart. It shows today’s rally as wave I of (3) of c of 3 in the SPX. This means we “should” still see a wave ii into our Bradley turn date of 4/22. And, assuming that next pullback is corrective, and we then take out the high we are making for wave I of (3), then we should be surging to the 2165 level around the start of May. In fact, the major and minor Fib levels work almost perfectly with this scenario, and it should not drop below the 2084/92SPX support zone in this pattern.
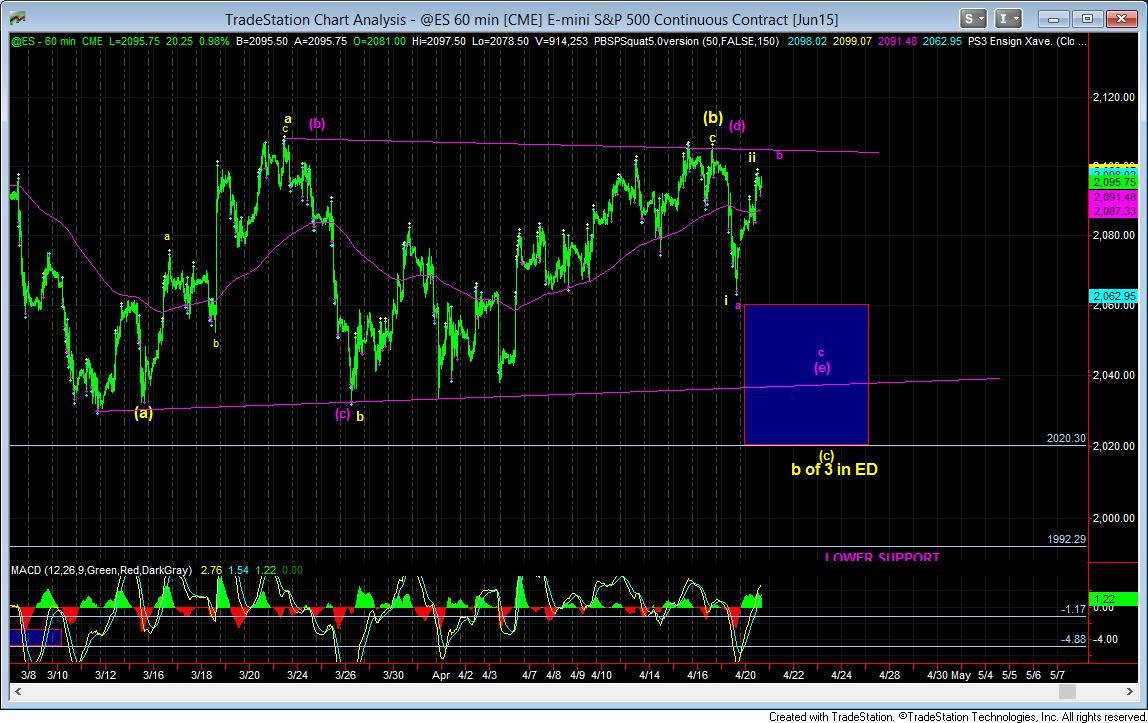
However, the alternative counts, as presented on the 60 minute ES charts look quite different than the SPX. In those we have two set ups which would take us below the low we made on Friday. In fact, it is an almost perfect set up in the yellow count to take us down to the 2021ES target in quick fashion. For this reason, I noted in the room today to all those that are long the market like I am to consider re-hedging here once again. My reasoning is that once we make this high for wave I (assuming it stays below last week’s high), and pullback in a wave ii, you can stop out of those hedges once this high gets taken out in wave iii of (3) – or, alternatively, once we break out over last week’s high, which would invalidate any immediate bearish pattern. However, should the larger pullback occur, you would have protection in place. But, again, a lot depends on how you trade and your own risk management in this region.
Now, I also want to add that seeing the IWM as having bottomed already is a lot more difficult, even though it is the more bullish of the two indices from a larger degree perspective. But, should the SPX prove its bullish intent, my expectation is that the IWM will likely catch up and well surpass the moves seen in the SPX.
So, ultimately, we have one more break out signal we await, which may not occur until Wednesday or Thursday of this week if further lows are not in the cards. But, the next drop in the markets will likely tell the story, of course, unless the market takes out the highs from last week sooner than that. Over last week’s highs invalidates any immediate short-term bearish potential on the charts.