The Market That Won’t Stop
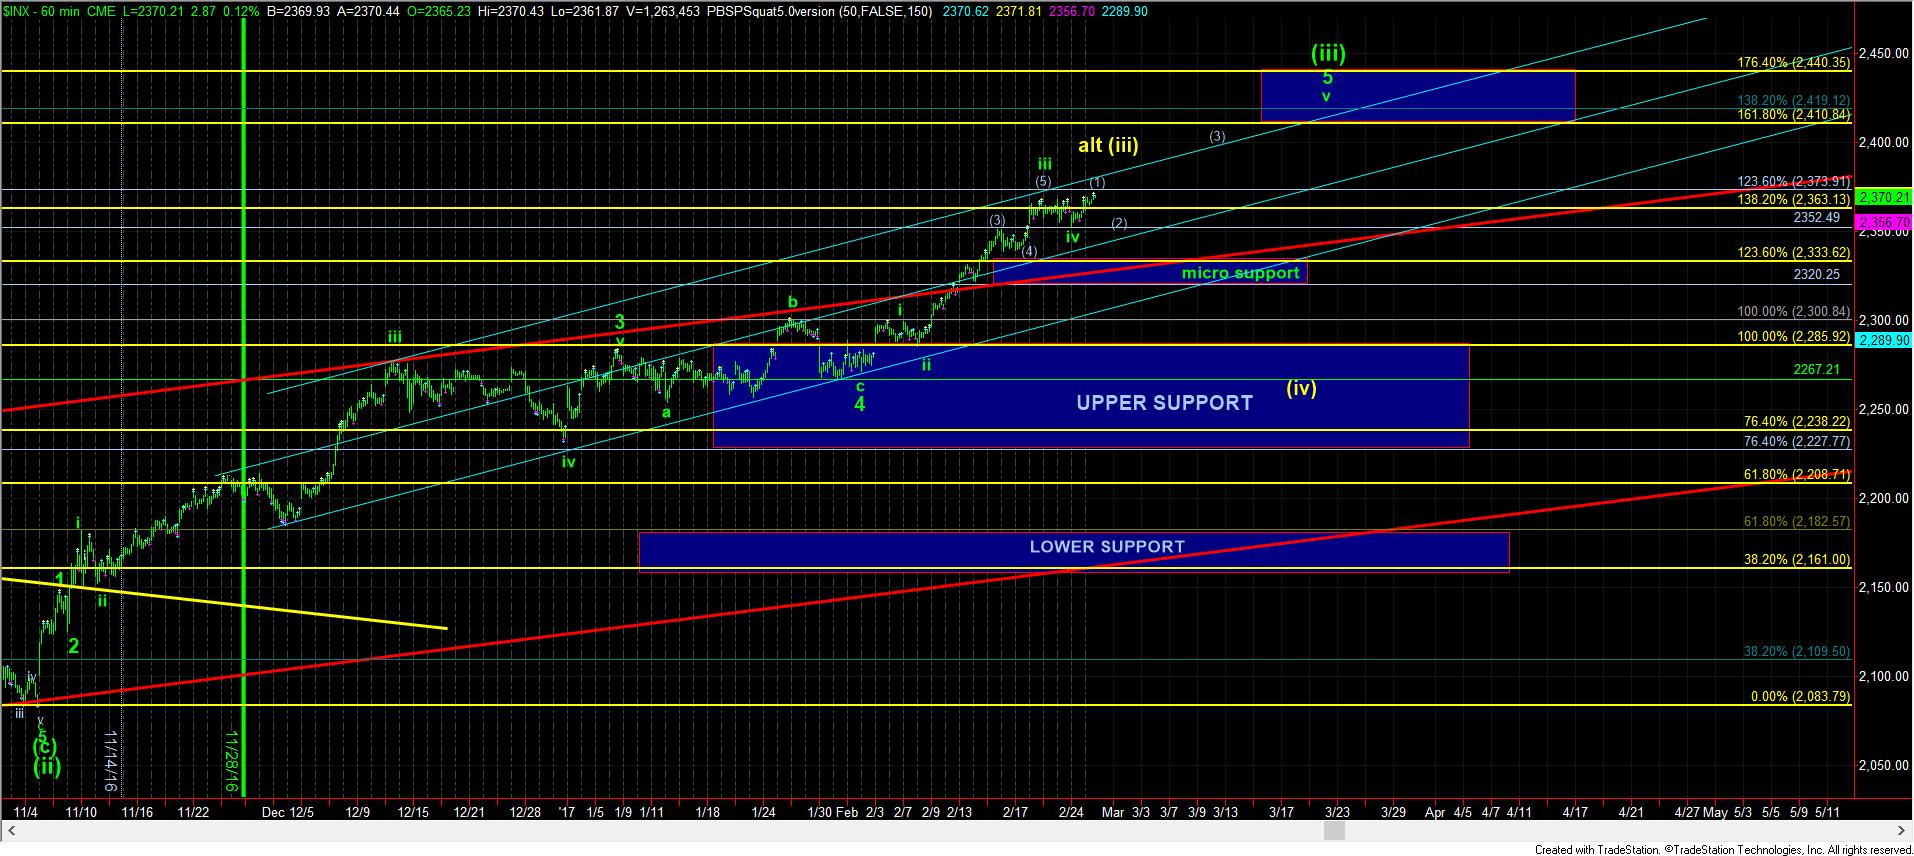
It seems my fears may have been warranted. While I really wanted to see a REAL pullback in wave iv, it now seems we may have seen a very high consolidation for wave iv. That means that a larger degree wave v may have begun, with this being only wave (1) of that wave v of 5 of (iii), or we may truncate wave v, as presented in the yellow count. And, to be honest, it is hard to tell just yet.
Unfortunately, the only way to tell the difference between the two potentials is based upon the next pullback. Once we complete a micro 5 waves up in this move on the SPX, and then drop back off those highs, as long as we hold support 2352SPX, and then rally over the high we are about to make, then I would view us as rallying towards the green wave v of 5 of (iii) towards 2400SPX.
However, a break down below 2352SPX would have me take a bit more of a conservative view, and consider us already in yellow wave (iv).
After the action today, I would much prefer the market head higher over the next week to complete wave v of 5 of (iii), which would make the next larger degree pullback wave (iv). But, if we are going to break 2352SPX before that happens, I will become more cautious and view us as already having started wave (iv), unless I see clues suggesting otherwise.
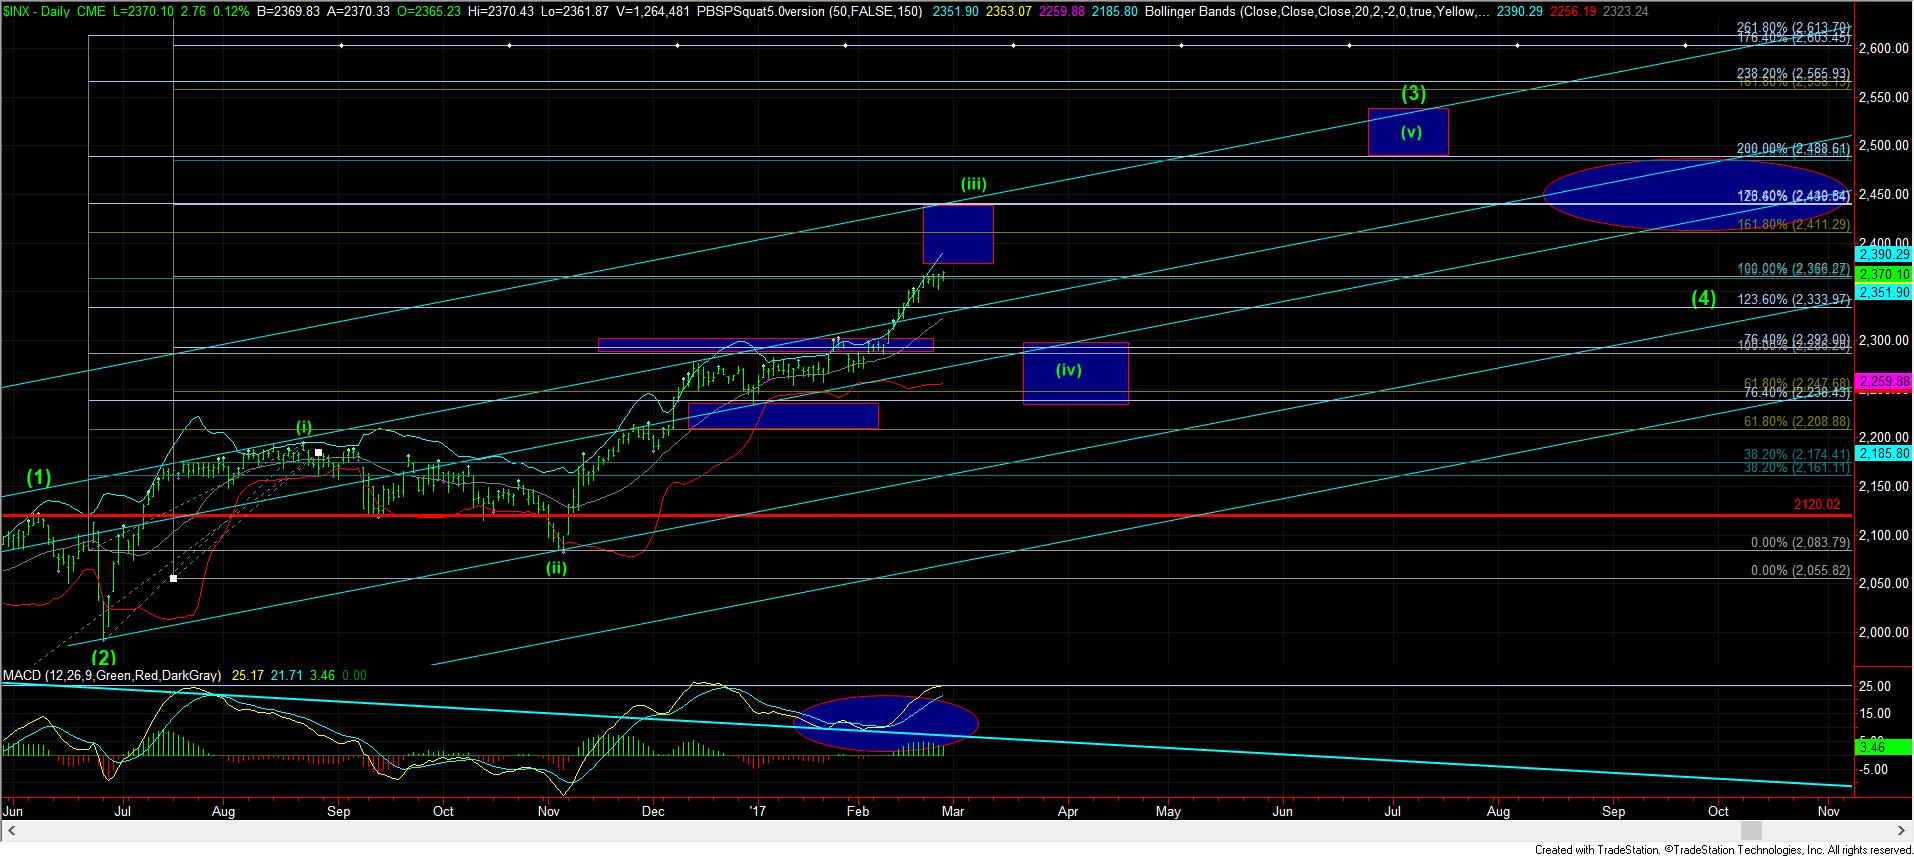
Lastly, I want to still make sure that our members are focusing on the bigger picture, as presented on the daily chart. Remember, the probabilities still suggest that this market has much higher to go in 2017, as we have been calling for over a year now. But, where this (iii) completes is still what we are questioning. The next strong drop off a high will likely signal that wave (iv) has begun, rather than the “crash” everyone else will assume is occurring.