The Market Pushing The Limit To The Downside
 By
By
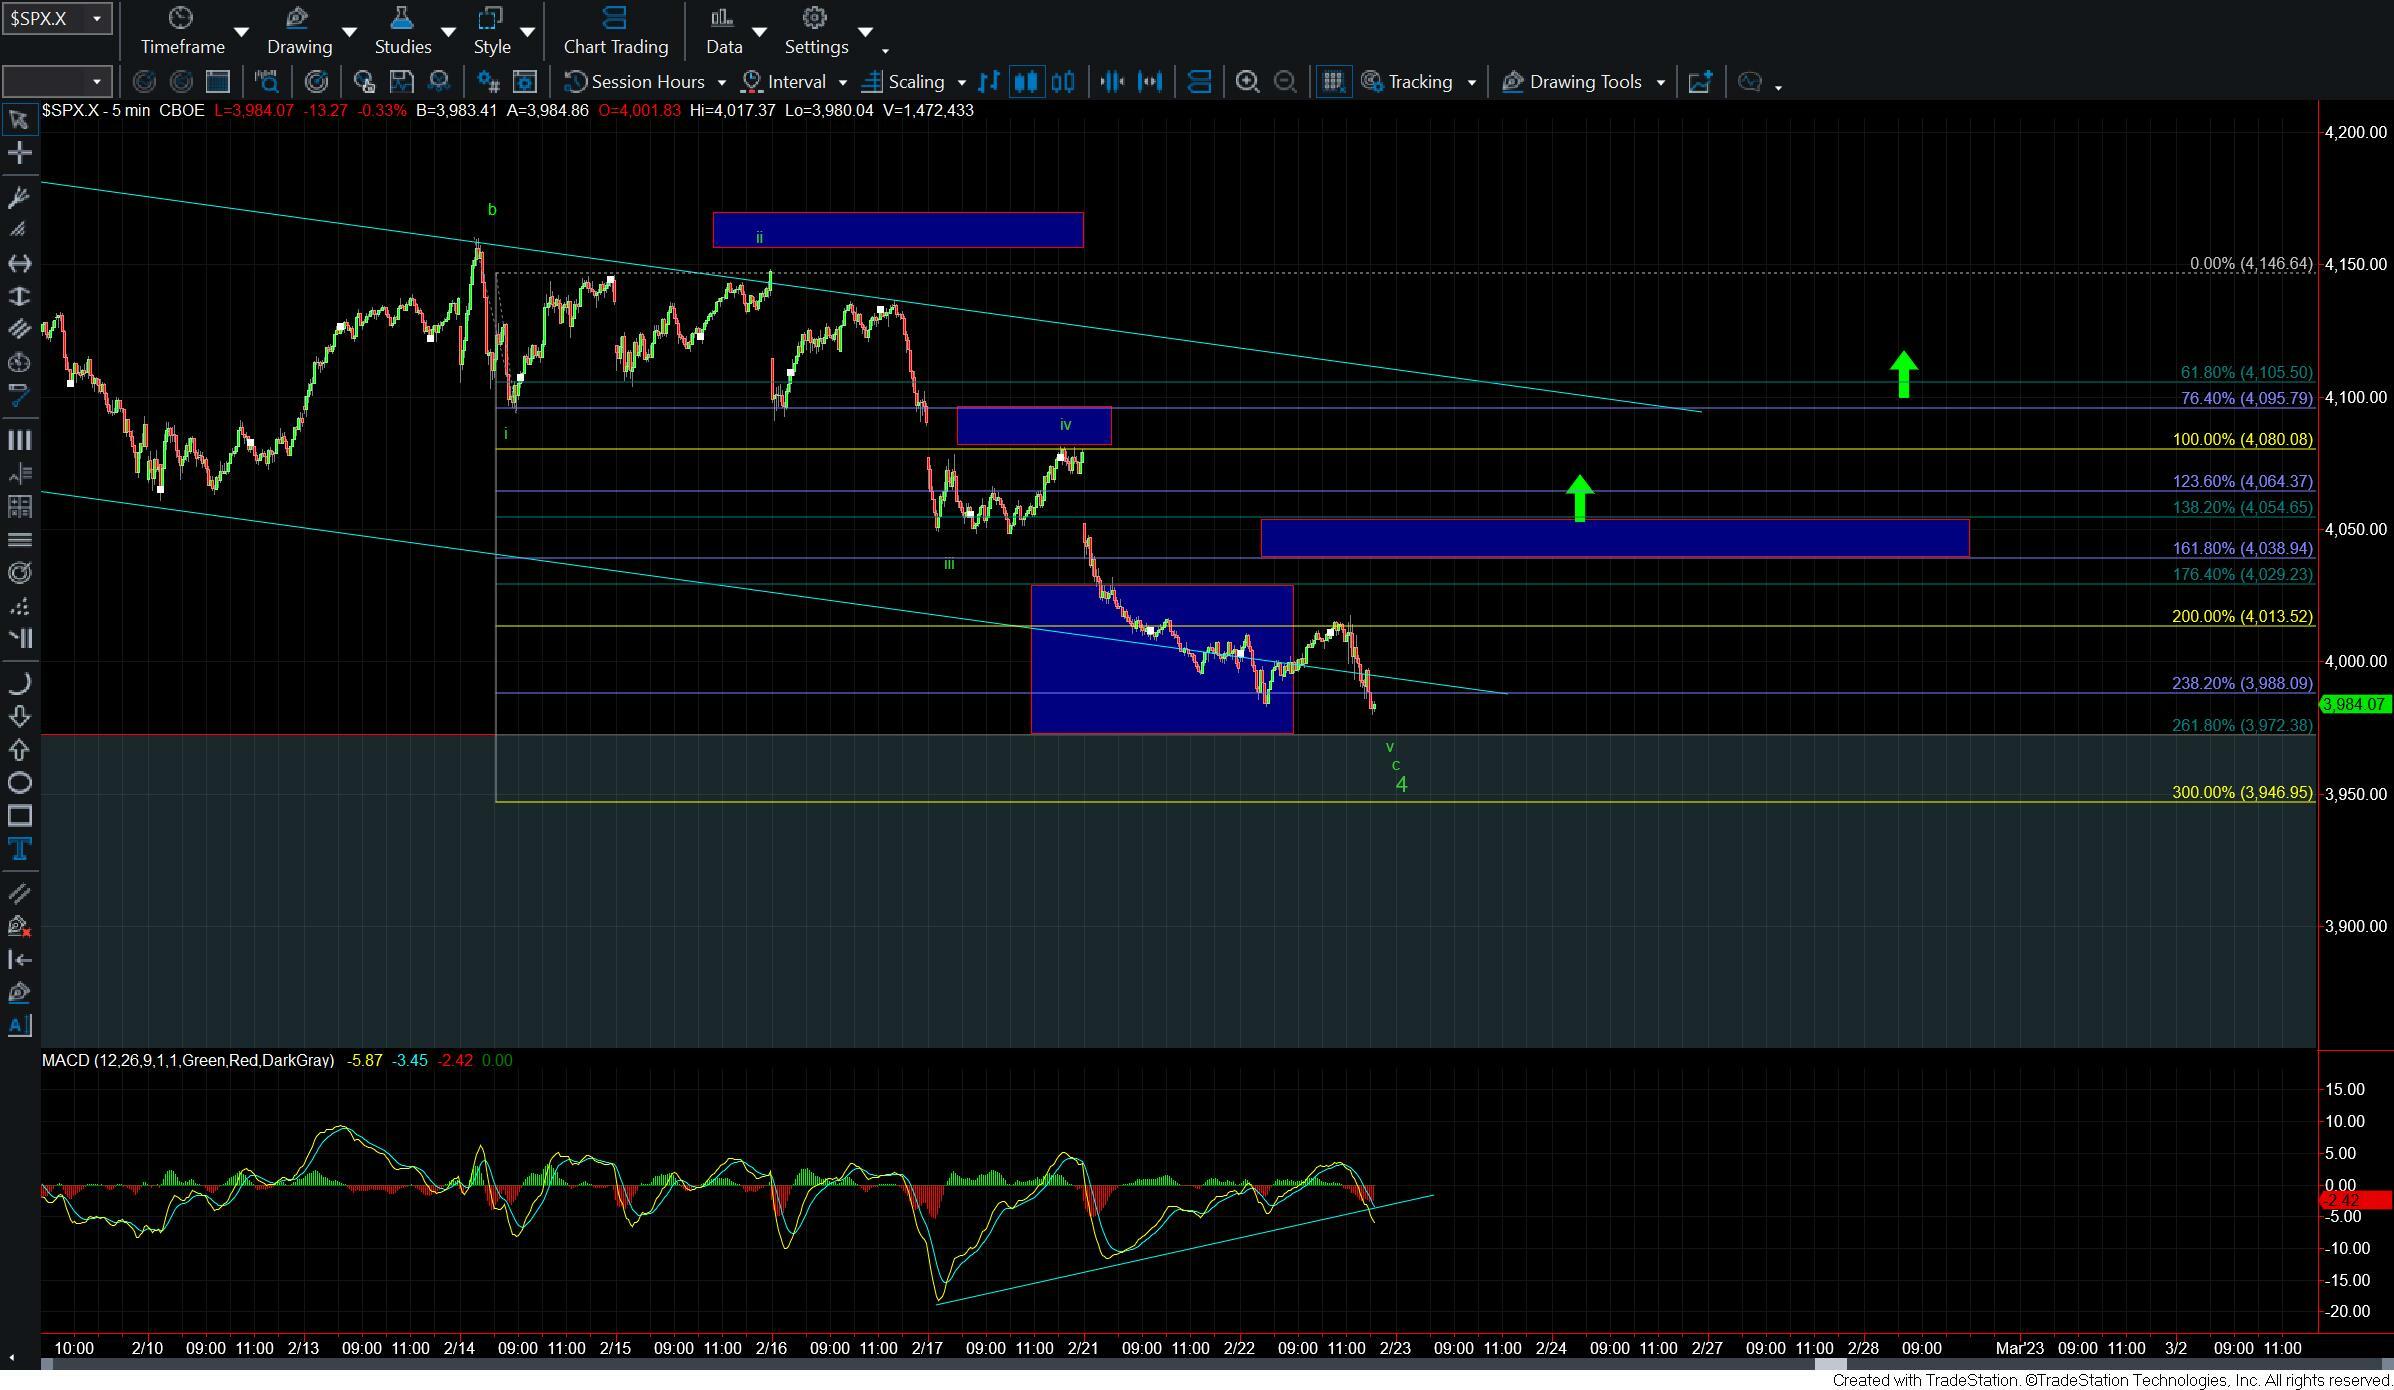
Today the market opened flat but found support near the 3980 region and then moved higher into the afternoon session. As we moved into the final hour of trading we saw the market fall to new lows once again thus closing in on the lower end of support for the potential green wave 4 which I have at the 3972 level. As I noted yesterday if we break that 3972 level then it would open the door for the market to see a deeper retrace before finding a larger degree bottom which I will once again layout in detail below.
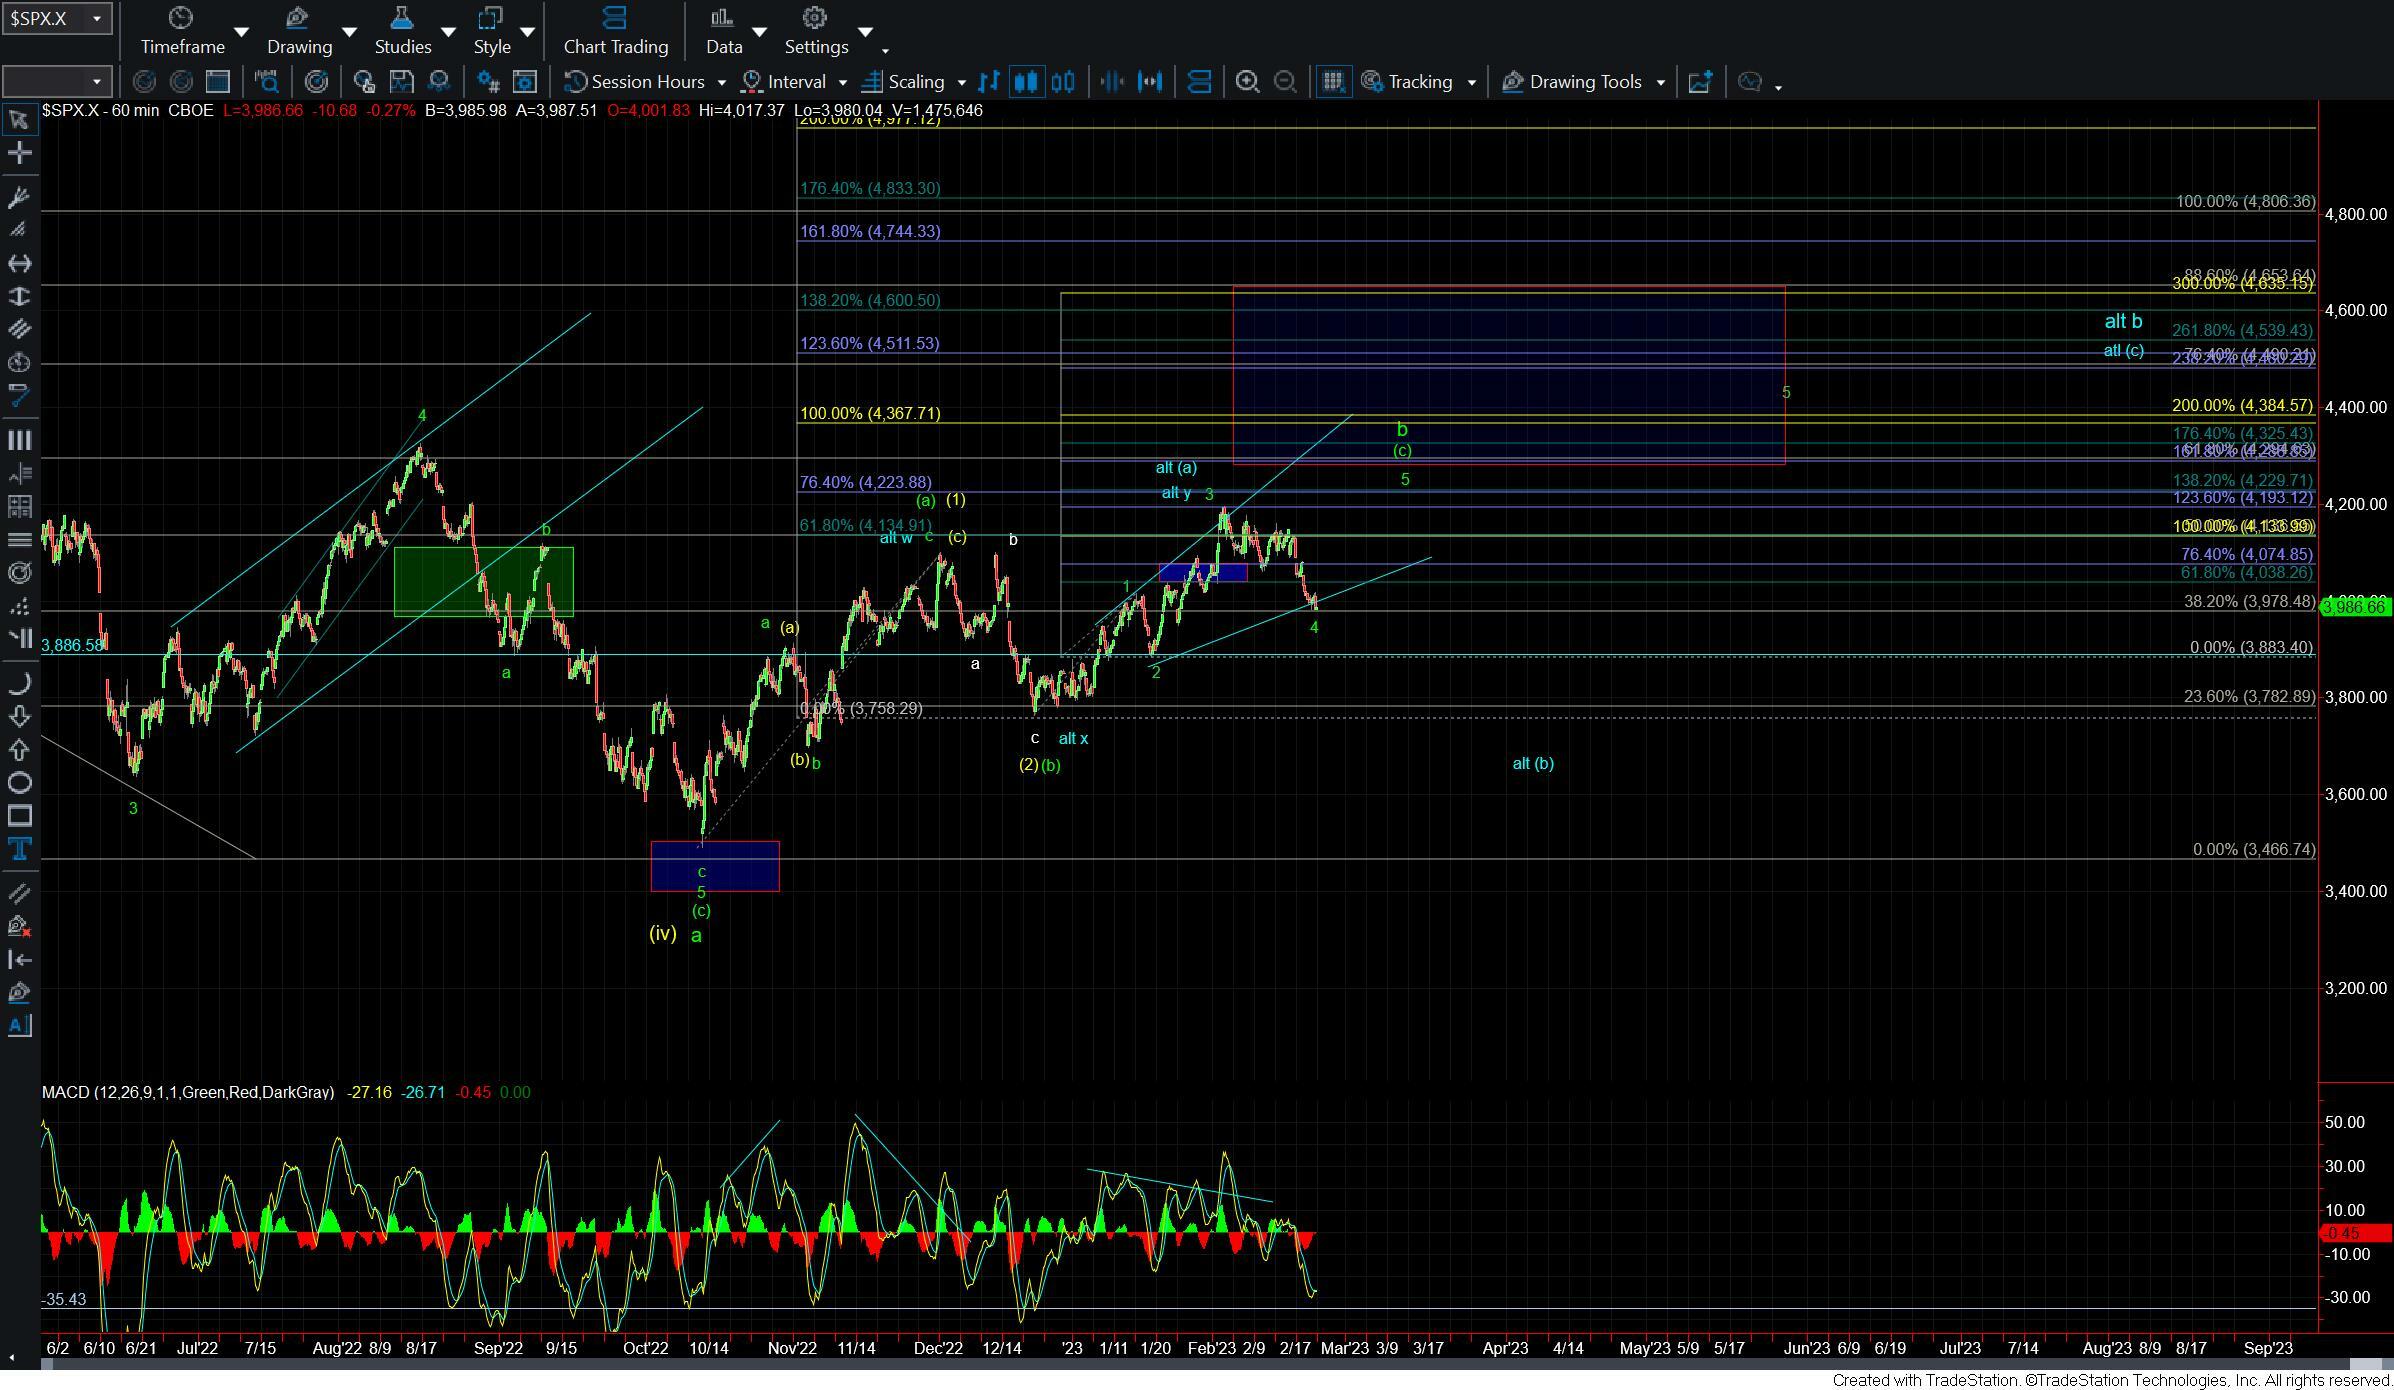
As I noted yesterday and as shown on the 60min chart the pattern to the upside still looks incomplete. This is the case even as a corrective move to the upside as the wave (c) of b still only has three waves. For that reason, I am still leaning towards seeing another higher high to finish the wave 5 of (c) of b per the green count.
With this move to new lows the initial signal of a bottom now comes with a break back over the 4013 high, followed by a break back over the 4029-4054 zone overhead. From there I would want to see a break back over the 4080-4095 zone to give us further confirmation that a bottom is indeed in place. Keep in mind that because we are likely dealing with an ending diagonal we may not see a five-wave move up off of the lows to start the next leg up.
If we are unable to hold that 3972 level however then it would open the door to the alternate path shown in blue. Under that alternate case, we would have topped in a more complex corrective wxy pattern. I would then likely count the high at the 4203 level as the top of a wave (a) of the larger wave b. This would suggest that the current move down off of that high is part of a wave (b) within a larger wave b. If we are unable to hold the 3972 level and then see a further breakdown under the 3883 level then it would open the door to this blue count. As long as we hold that zone however the green count will remain my primary count and I will be looking for another higher high to finish off the abc pattern off of the October lows.
Unfortunately with this push down into the lower end of support, we are left with two less-than-ideal counts. Both of these counts have their issues and are far from ideal. This does make it difficult to give a high degree of confidence as to which is the primary path. For that reason, we need to remain vigilant in this region as well as nimble. With all of that said the blue count is still a less common outcome than the green count which is why for the time being and as long as we hold 3972 I am going to give the green count the benefit of the doubt.