The Market Just Got Infinitely More Complex
Today, we broke down below the immediate support which kept pressure strongly to the upside, and opened the door to several possibilities in the market, for which I still need more information before I can quantify the probabilities.
I want to first prepare you that you will have analyze each potential I am outlining below, so please take your time with this update so you understand the implications of the additional complexity with which we are now faced.
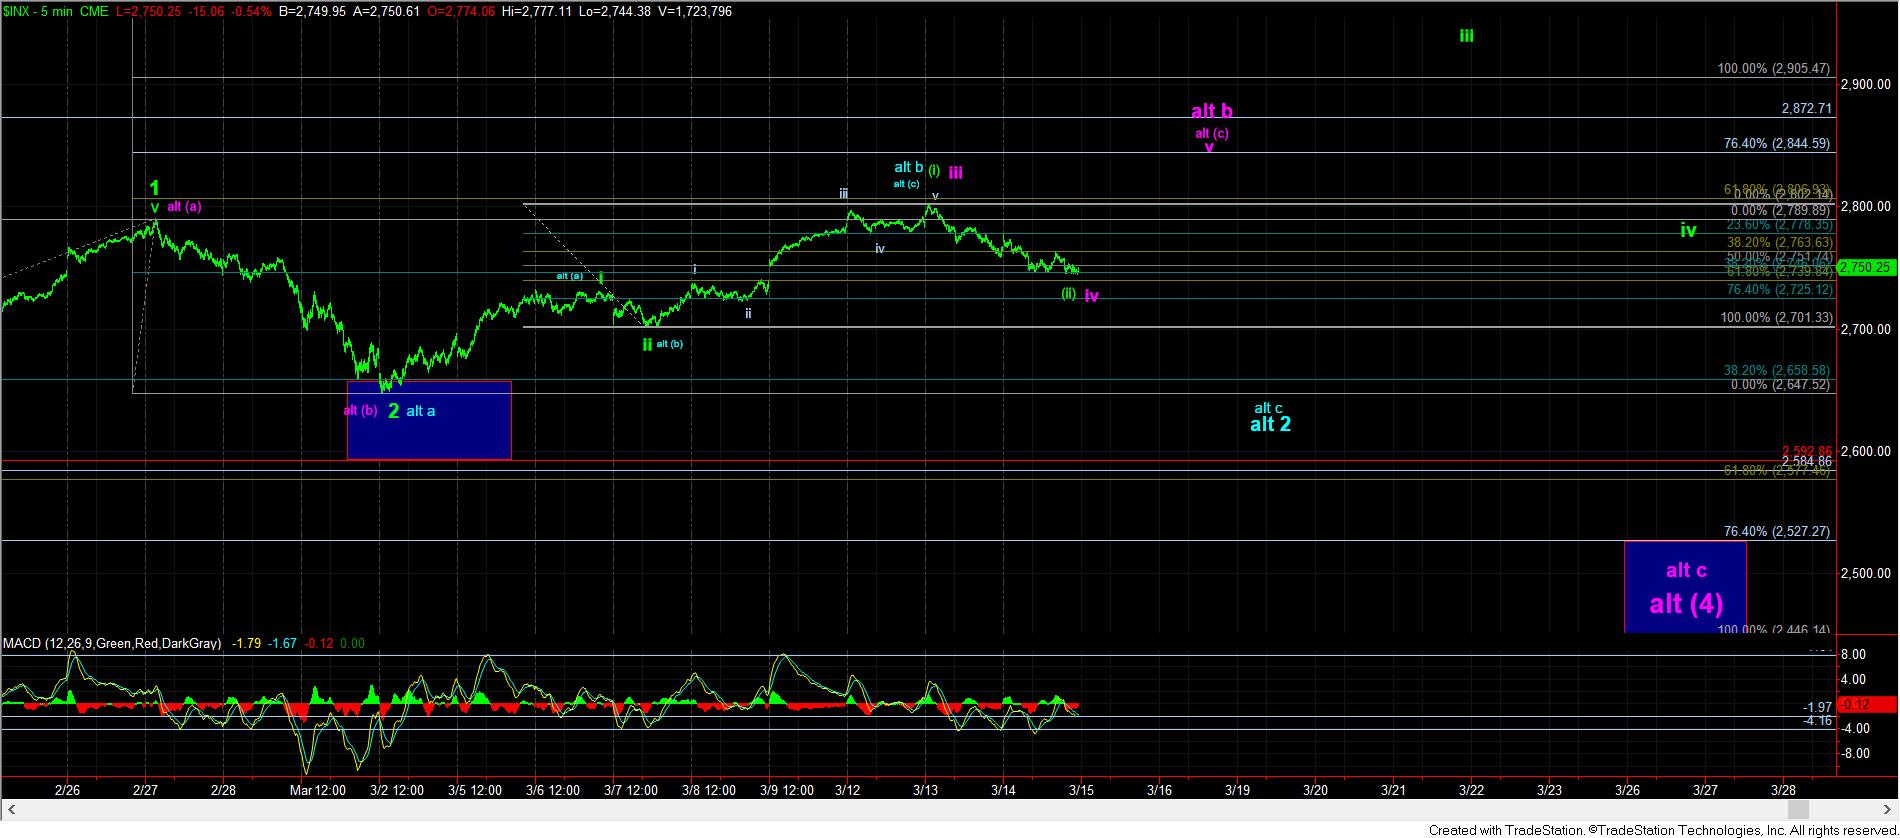
Let’s start with analyzing the action over the last 12 hours. While the market held the support box I provided to you on the ES chart yesterday evening, and rallied strongly off that low overnight, it was never able to develop escape velocity this morning.
Early this morning, I sent out an alert to subscribers noting that we only have 3 waves up off the overnight lows. The set up I presented was that if the market would be able to provide us with 5 waves up, then you can buy a wave 2 pullback for a continued rally this week. And, if the market was not able to provide us with a 5th wave higher, it would suggest that we could break down below the overnight low, and drop as deeply as the 2738ES region. As we know, the market never provided us with that 5 up, and turned down and broke the overnight low.
As a side note, even when the market does not provide us with the structure we want to see, it still often provides us strong clues as to how it will react in its next move. That is why I say that the market does not often surprise us with its moves, since it usually provides advance warning based upon its structures, as it did early this morning. In fact, once we approached the 1.236 extension near 2806SPX earlier this week, our structure suggested we would come back to test the 2754-67SPX region. But, on that pullback, we clearly have not held that support. And, that is often a warning to the bullish side of the that pattern.
The fact that we have now broken below 2750SPX has certainly opened the door to several potential structures, and I do not have enough information yet to be able to distinguish between them with any higher probabilities. So, I will present them to you this evening for you to review and contemplate.
The one common factor between these potentials is that as long as we now hold over 2733SPX/2738ES region, I think we can still rally higher than the level we struck earlier this week. That would suggest we can approach the 2844SPX region next. Should that rally take shape, how the market reacts off that region will be the main key to determine between the continued bullish structure, and the more bearish structure in purple.
Now, if the market first breaks down below 2733SPX, and follows through below 2725SPX, I would move to the blue count as my primary expectation. Many of you will then ask me why I would not automatically consider that we are in the purple wave (4) to much lower levels? Well, the problem with automatically assuming that we are in the purple c-wave of wave (4) to much lower levels is that we only have a 3-wave rally into the high we struck this week.
Let me explain why that is an issue. When you have an a-b-c structure, the b-wave of that structure (such as our purple b-wave) itself should have an (a)(b)(c) structure. And, the (c) wave of that structure itself should be a 5-wave structure. So far, if this really is a purple b-wave top we are developing, we only have 3 waves up off the purple (b) wave low. This suggests that the probability that we have a purple b-wave top in place after only a 3-wave rally is much less likely, at least based upon the probabilities of the standard structures with which we analyze markets. This is why I would primary classify a break down below 2725SPX as us having struck the blue b-wave top in a bigger wave 2 flat.
So, now that I have explained why the market has added significant complexity with a break below 2750SPX today, let’s try to develop a plan.
As I noted earlier, as long as we hold over 2733SPX, I can still be looking to the long side towards the 2844SPX region. That would be under both the purple count, and the much more bullish green count. So, as long as we hold over 2733SPX, I am going to be looking towards the 2844SPX region before we can begin to make a distinction between the purple and the green count. And, as noted before, I will continue to move support up should we begin a strong rally higher.
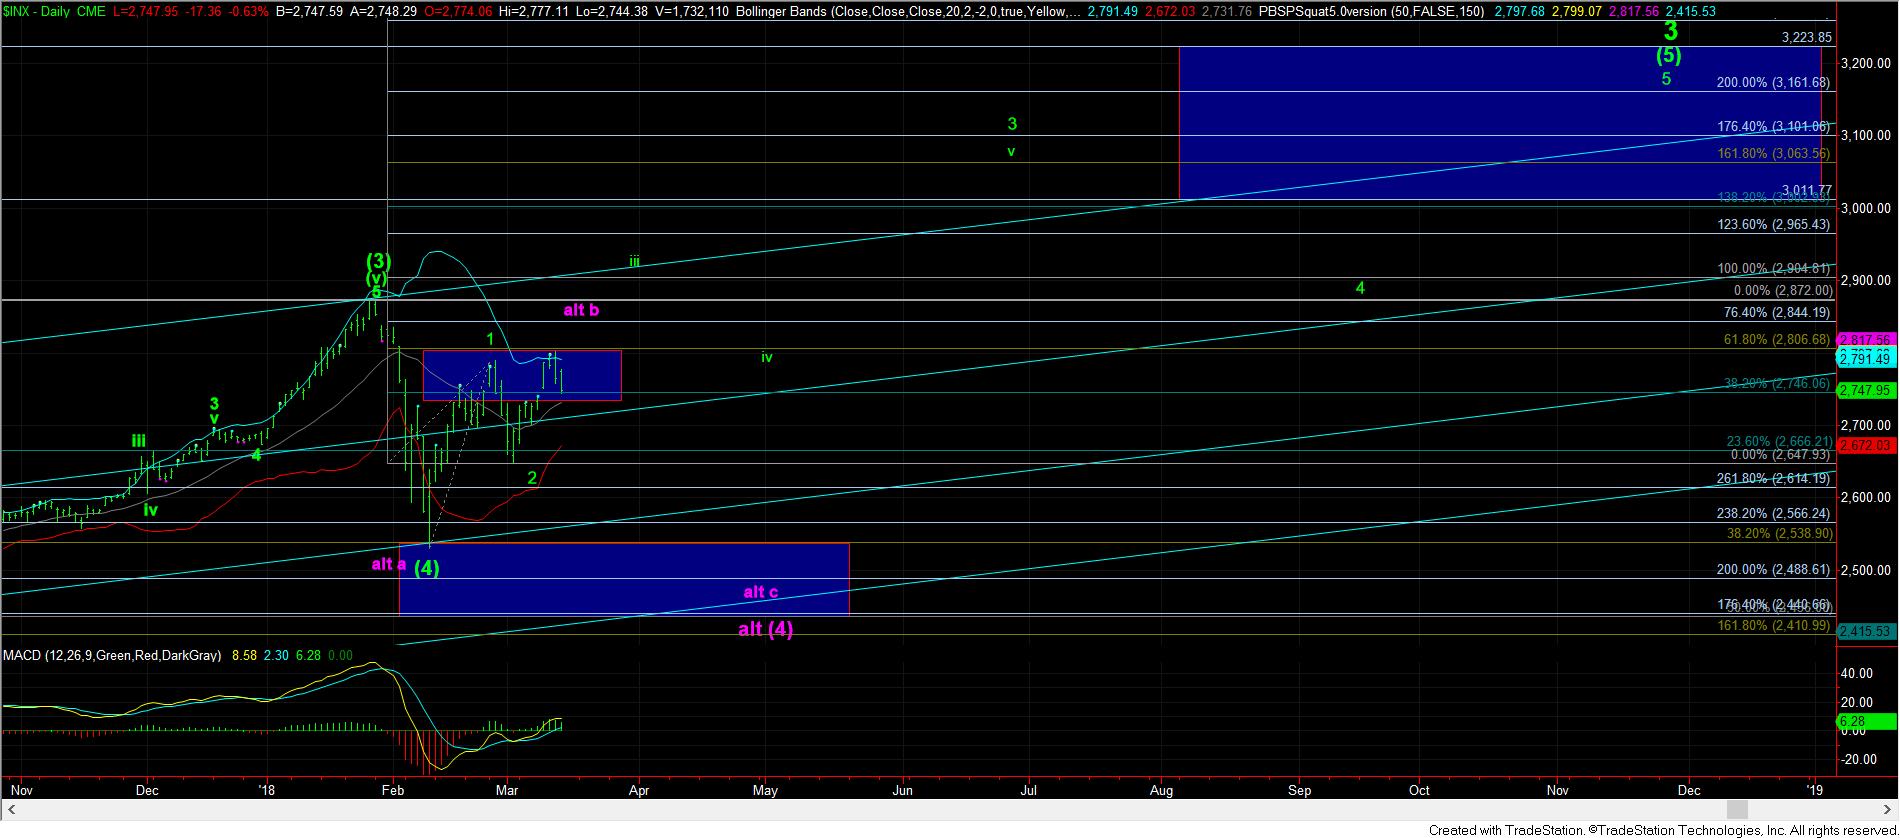
Alternatively, should we see a sustained break of 2733SPX, with follow through below 2725SPX, that would have me looking back down towards the 2660SPX region for a larger wave 2 flat pattern. And, should the market not be able to hold that support, then it clearly opens the door down to the 2530SPX region, with potential to extension down to the 2440SPX region.
So, due to the additional complexity with which we are now grappling, we will have to take this one step at a time. But, please keep in mind that the larger degree potential is that the market can still head up to the 3011-3223SPX region in 2018. This is likely just a pullback, and we are simply trying to sort through which degree of pullback we are dealing with over the next few weeks. Please use the guideposts I have provided you to navigate these choppy waters, and as we get more information, much more clarity will appear in the coming week.