The Market Is Pointing Lower - But, Will It Give Us A Bounce First?
With the break down below 2920SPX, the market has made it rather clear that the greater probability patterns point to us still being within a larger degree corrective structure. Moreover, it also suggests that lower levels are likely to be seen over the near term.
What is still a question as my writing this update is the path to which we get to those lower levels. Allow me to explain.
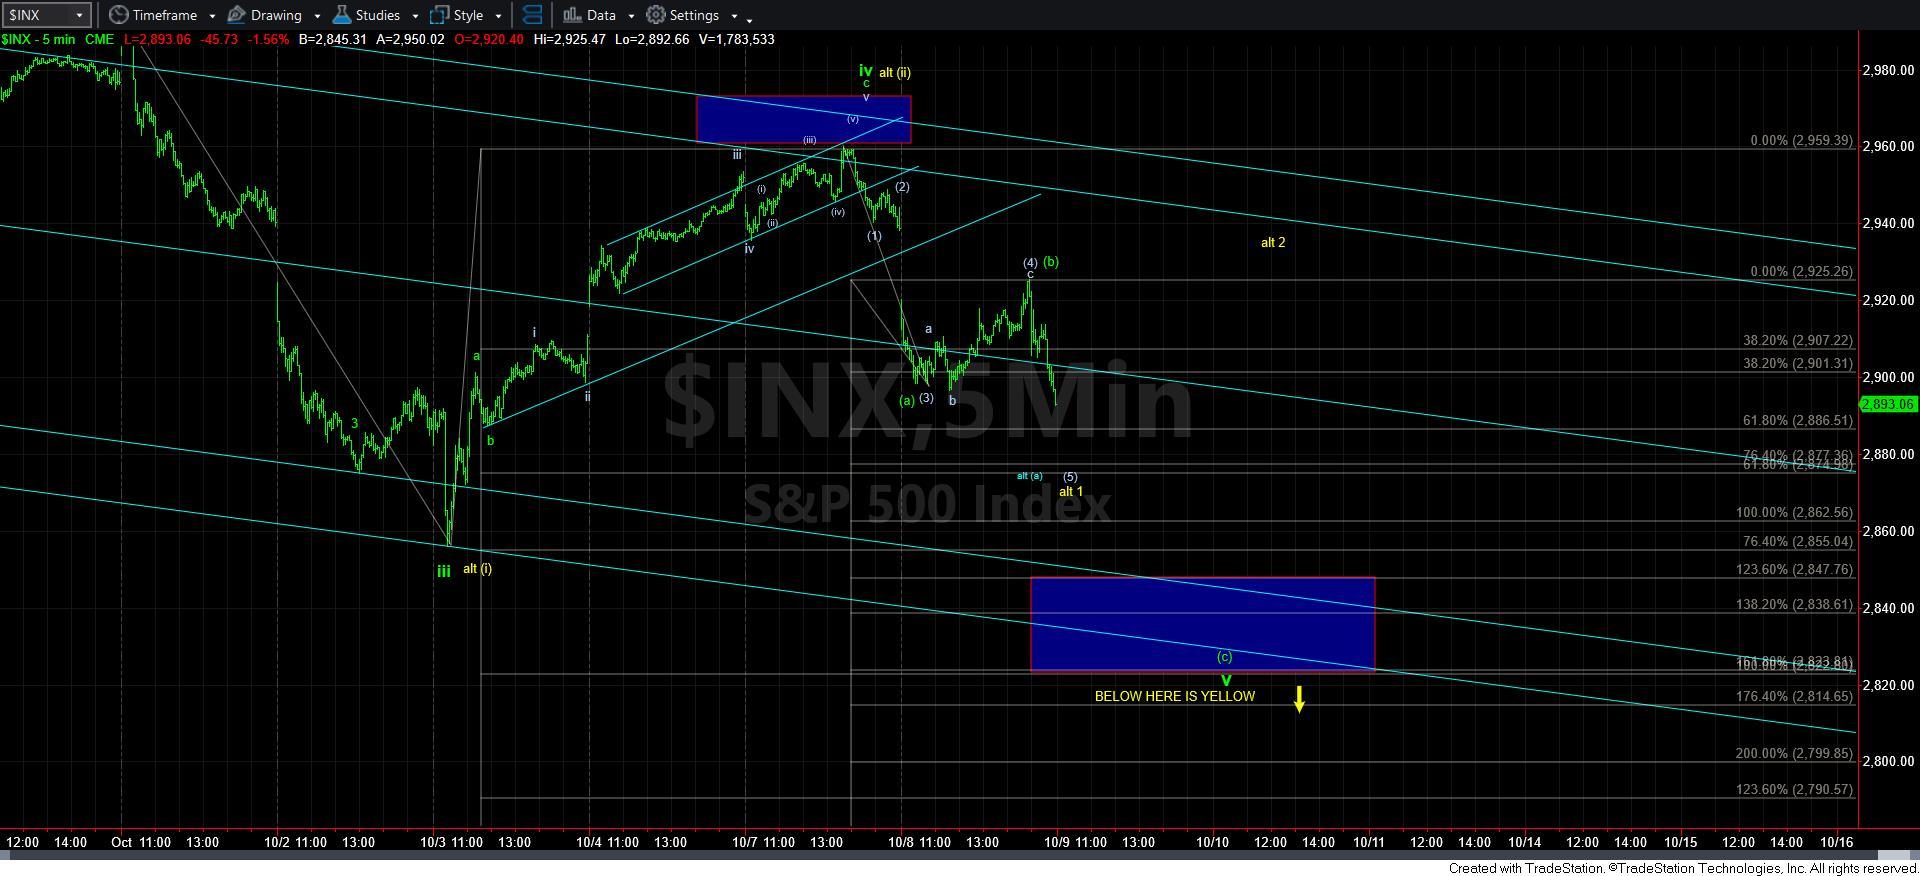
My primary expectation is that the market is setting up a decline to AT LEAST the 2820SPX region. In that structure, it would mean that the high we struck yesterday was the top to wave IV of a diagonal (as presented in green), with the decline today being the [a] wave of the [a][b][c] wave V decline.
Now, here is the complication. An [a] wave can be a 5-wave structure, but the great majority of the time it is only a 3-wave structure. So, it leaves us with a question as to whether the bottom struck early in the day was all of the [a] wave of this decline, with the rest of the day being spent in a [b] wave? That would mean we have begun the [c] wave down already, with the drop at the end of the day representing wave 1 of the [c] wave down.
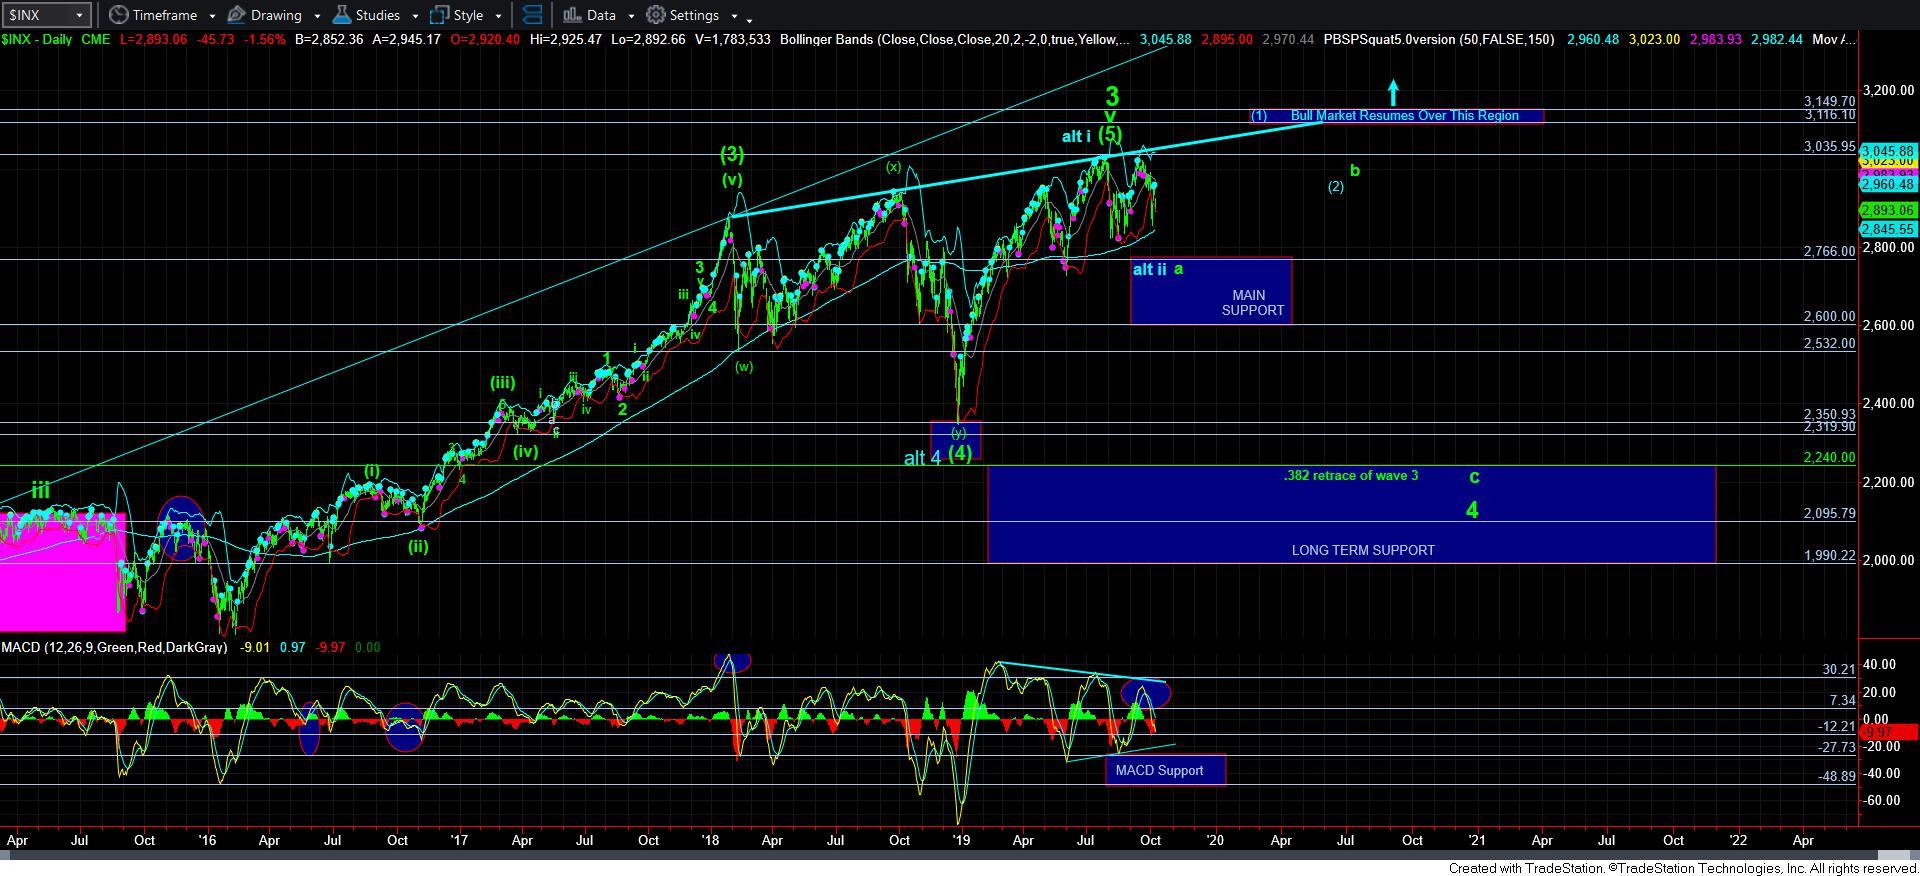
The other potential we have been tracking is that this 5-wave decline we have seen since the high yesterday is wave 1 of a larger i-ii, 1-2 downside structure, which would point us down to the 2600 region and rather fast.
And, of course, the other potential is that this 5-wave decline is a 5-wave [a] wave, with a [b] wave corrective rally still to come.
So, of course, the question is how do we know the difference?
Early this morning, I could already foresee these issues, which is why I said several times in the chat room that I am going to have to track both the yellow and green counts until 2820SPX is broken. You will begin to understand why in the following progression of analysis.
I am going to attempt to simplify this as much as possible, but it is a bit complex. So, please follow along with the chart.
As long as the market holds over the 2870SPX region, and then provides us with another corrective rally, I will view that bottom as either the yellow wave 1 or the bottom of the [a] wave. Take note that for this purpose, I have that [a] wave labeled in blue. If we do bottom there, then I will clearly modify that to be the green count.
However, if we see a direct break down below 2870SPX, then I have to FIRST assume that today’s action was the [a] and [b] waves, with the decline being the [c] wave. However, I have to warn you that the [c] wave target is quite large. The [a]=[c] target is 2862, but that would not even provide us with a lower low for the wave V, so I don’t see that as the most likely potential. Rather, I think the 1.382-1.618 extensions would seem more likely, which is in the 2820-47SPX region. And, since the other calculations point towards the 2820SPX region, that would be my primary target.
Next, if the market is unable to maintain support over 2820SPX, and we see a direct break down below that level, then we are likely in the full blown 3rd wave down in the i-ii, (i)(ii), 1-2 structure off the recent highs, and the high today was actually wave 2 of wave (iii) down. In this scenario, the minimum target I would have for wave (iii) of iii is in the 2770SPX region (1.382 extension of waves (i)(ii)), but the more likely target would seem to be in the 2740 region (1.618 extension of waves (i)(ii)).
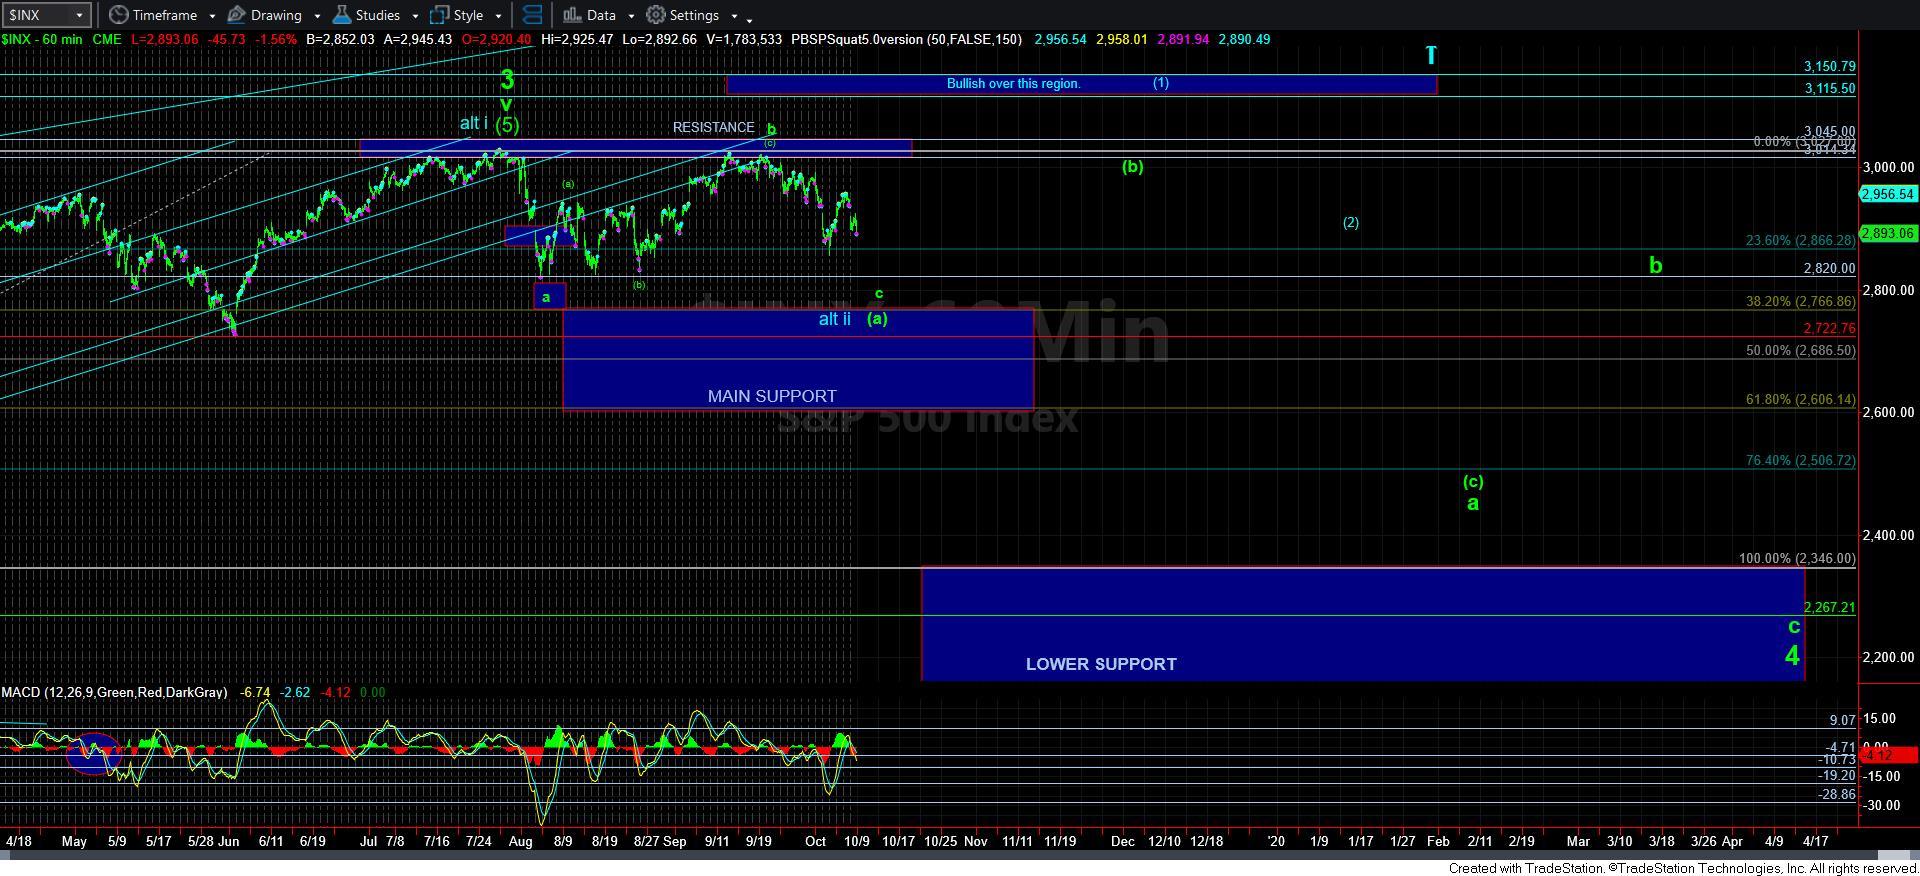
So, in summary, as long as we hold over 2870, then I will be looking for another bounce in either a wave 2 in yellow or a green (b) wave. However, if we break 2870SPX, then the main support to key in on is in the 2820-47SPX region, with 2820 as the ideal target. As long as that holds, then we have a bottom in a larger degree flat for this c-wave down, as shown on the 60-minute chart.
However, if that region also breaks, then the door opens wide for the heart of a 3rd wave, with this larger degree c-wave pointing us down as deep as the 2600SPX region over the coming several weeks.
Lastly, I have nothing that I can even consider as bullish at this time, other than a bounce which begins over the 2870SPX region. But, that will likely only set us up for another decline. In the bigger picture, much will depend on how the market reacts at the 2820SPX support region, which I have noted many times of late as my ideal minimum target for this downside at this time.