The Market Is Filling Out The Squiggles
 By
By
Today we opened higher and are now trading in the upper end of the resistance zone that should differentiate between the topping count that we are watching vs. the more bullish count that would ultimately take us to new all-time-highs. From a larger degree down to the more micro perspective we now have a potentially full count on all fronts and we are now just a few points away from a key resistance level which if broken would make it more likely that we are following that bullish path to new highs.
If we do see a turn down from around current levels we still do however need to watch the structure of the next move down as even seeing a top near current levels would not automatically suggest we have topped in the green count. We still would need a full five wave move to the downside and a break of support to confirm this path. We should however know within the next day or so whether we will see a more immediate breakout or whether the market is going to see at least a local top at which point we can begin to track the structure and the support upon any pullback.
GREEN COUNT
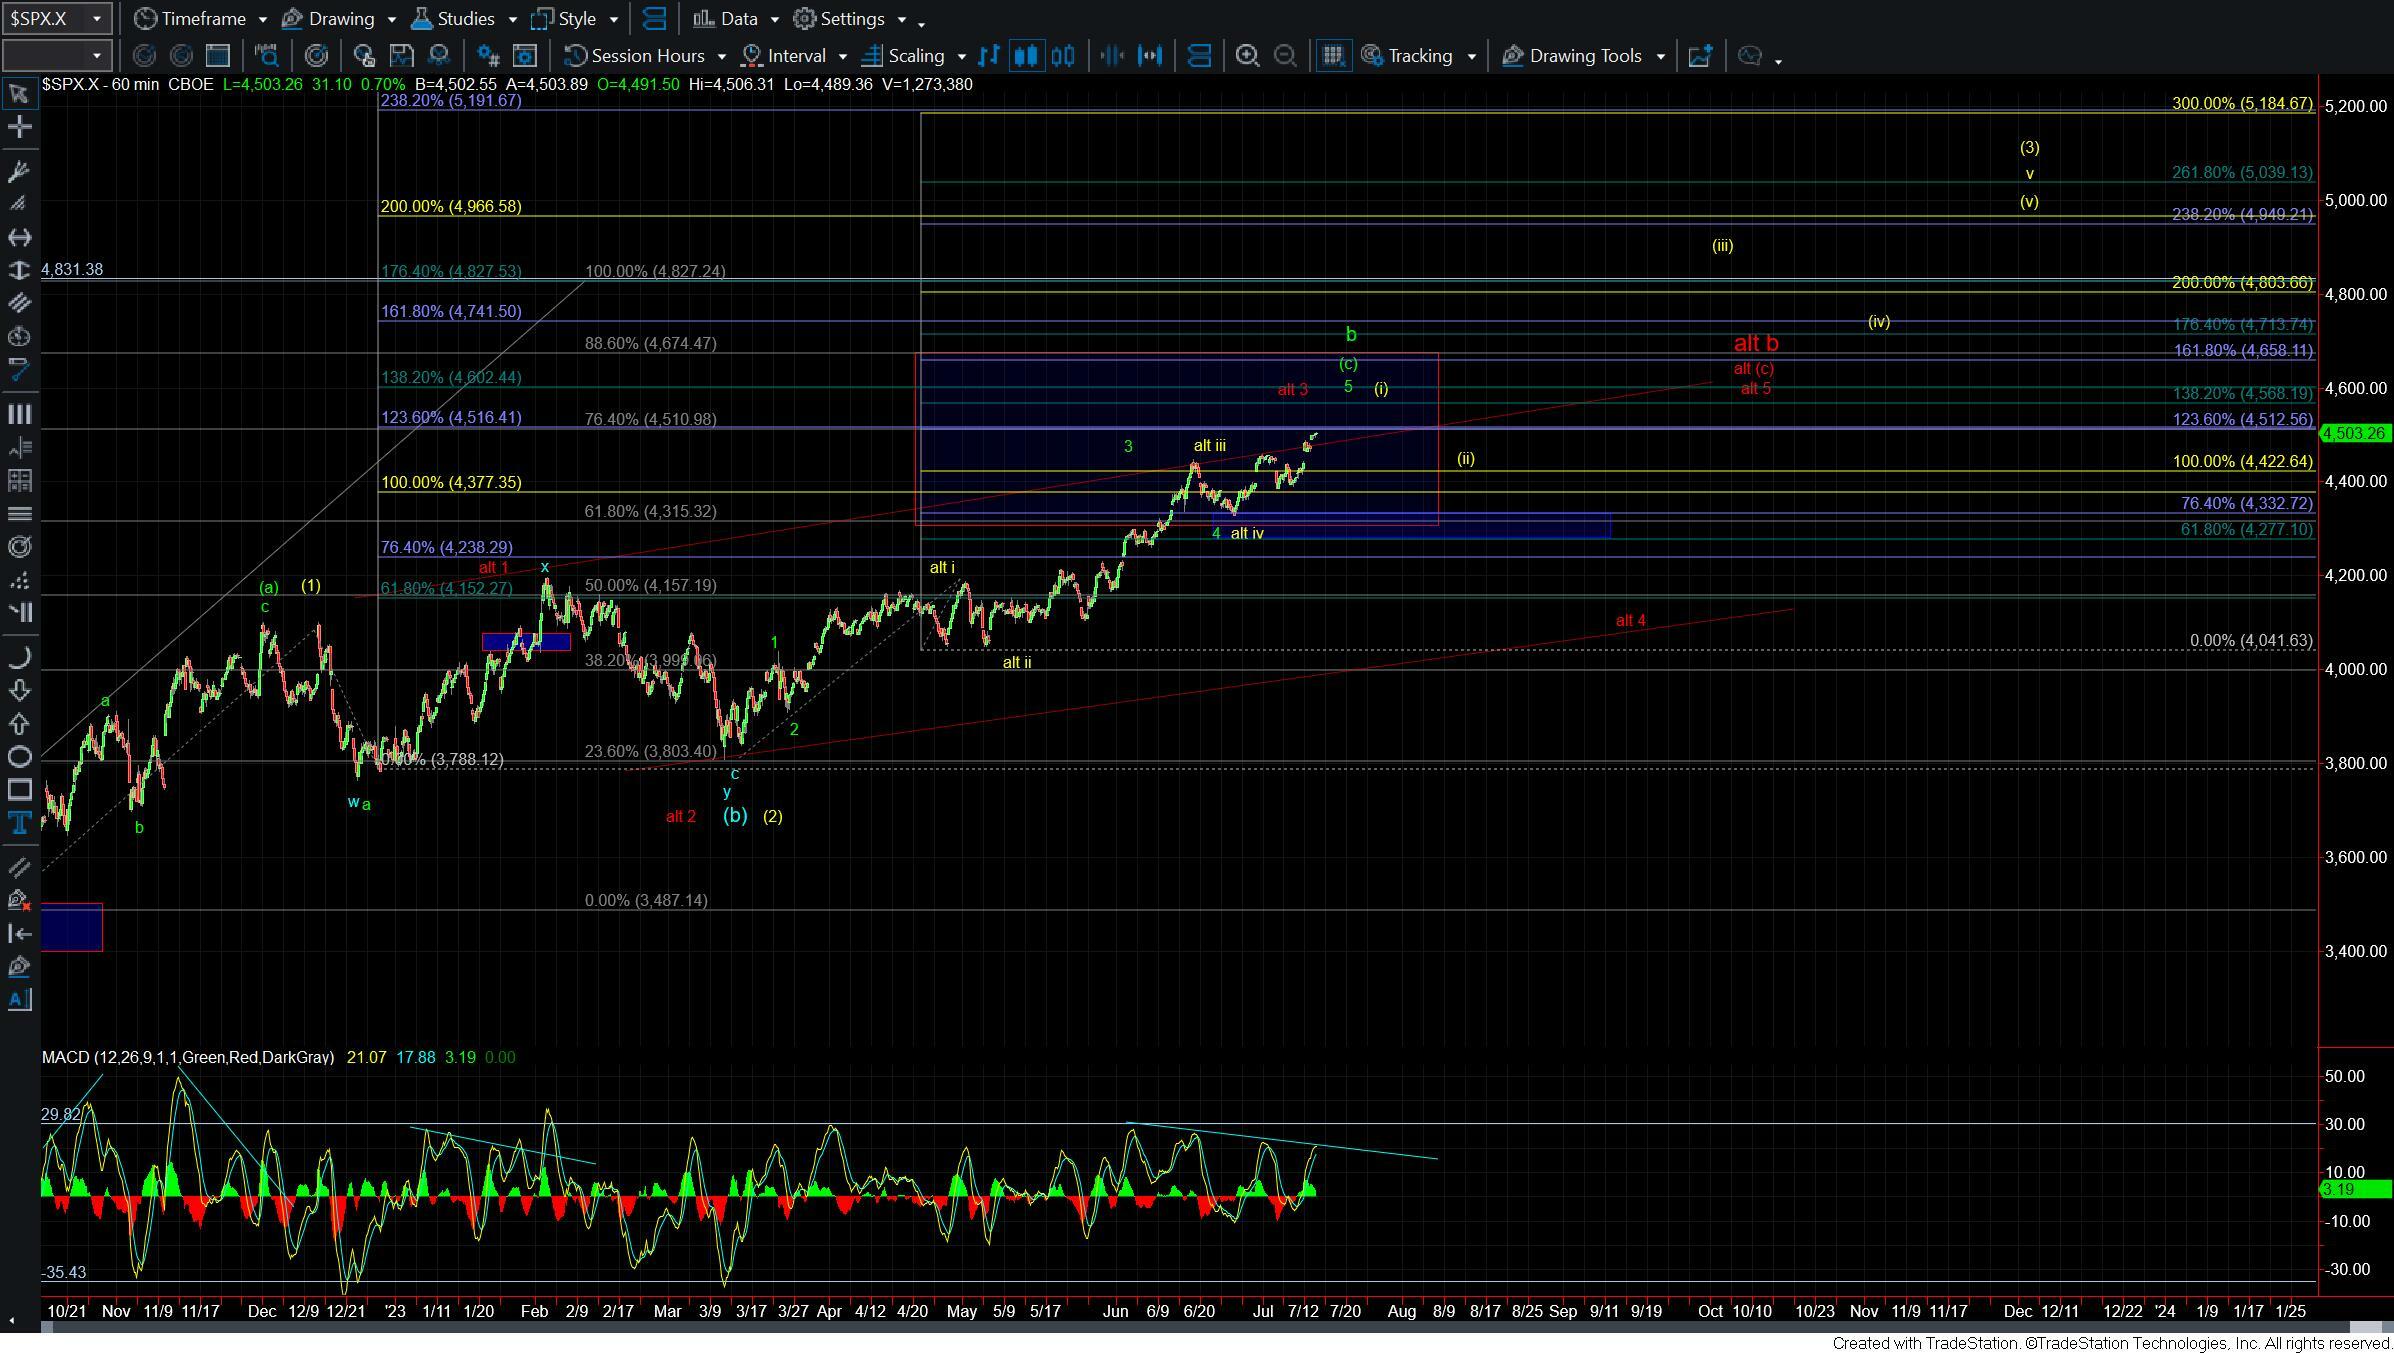
The green count which has the markets topping in a larger degree wave b are at key resistance on several timeframes. Starting with the larger degree timeframe we are now bumping up against the 76.4 retracement level of the entire move down off of the December of 2021 high. We are also at the 123.6 ext of the initial move up off of the October of 2022 low as well as several fib extension on the much smaller degree timeframes.
So with having so much fib confluence in this region this is a very key resistance and pivot level and if we are indeed topping in the green wave b we should see a turn down from around this region. If we do see a turn lower we would need to see the market give us a full five wave move to the downside followed by a break under the 4381 level and then the 4332 level to give us initial confirmation that we have indeed topped in that green wave b. If we pullback but do not do so on five waves and hold those support levels then it would signal that we are going to move higher per the yellow count.
YELLOW COUNT
Under the yellow count and pullback should take the form of three waves. So the structure of the next pullback is going to be critically important and something that we need to be watching very closely. Again IF that move down is clearly corrective and holds over the 4332 level then it would suggest that the pullback is simply the wave (ii) as part of a larger wave (3) per that yellow count, and it would keep the door open to a push to new all time highs.
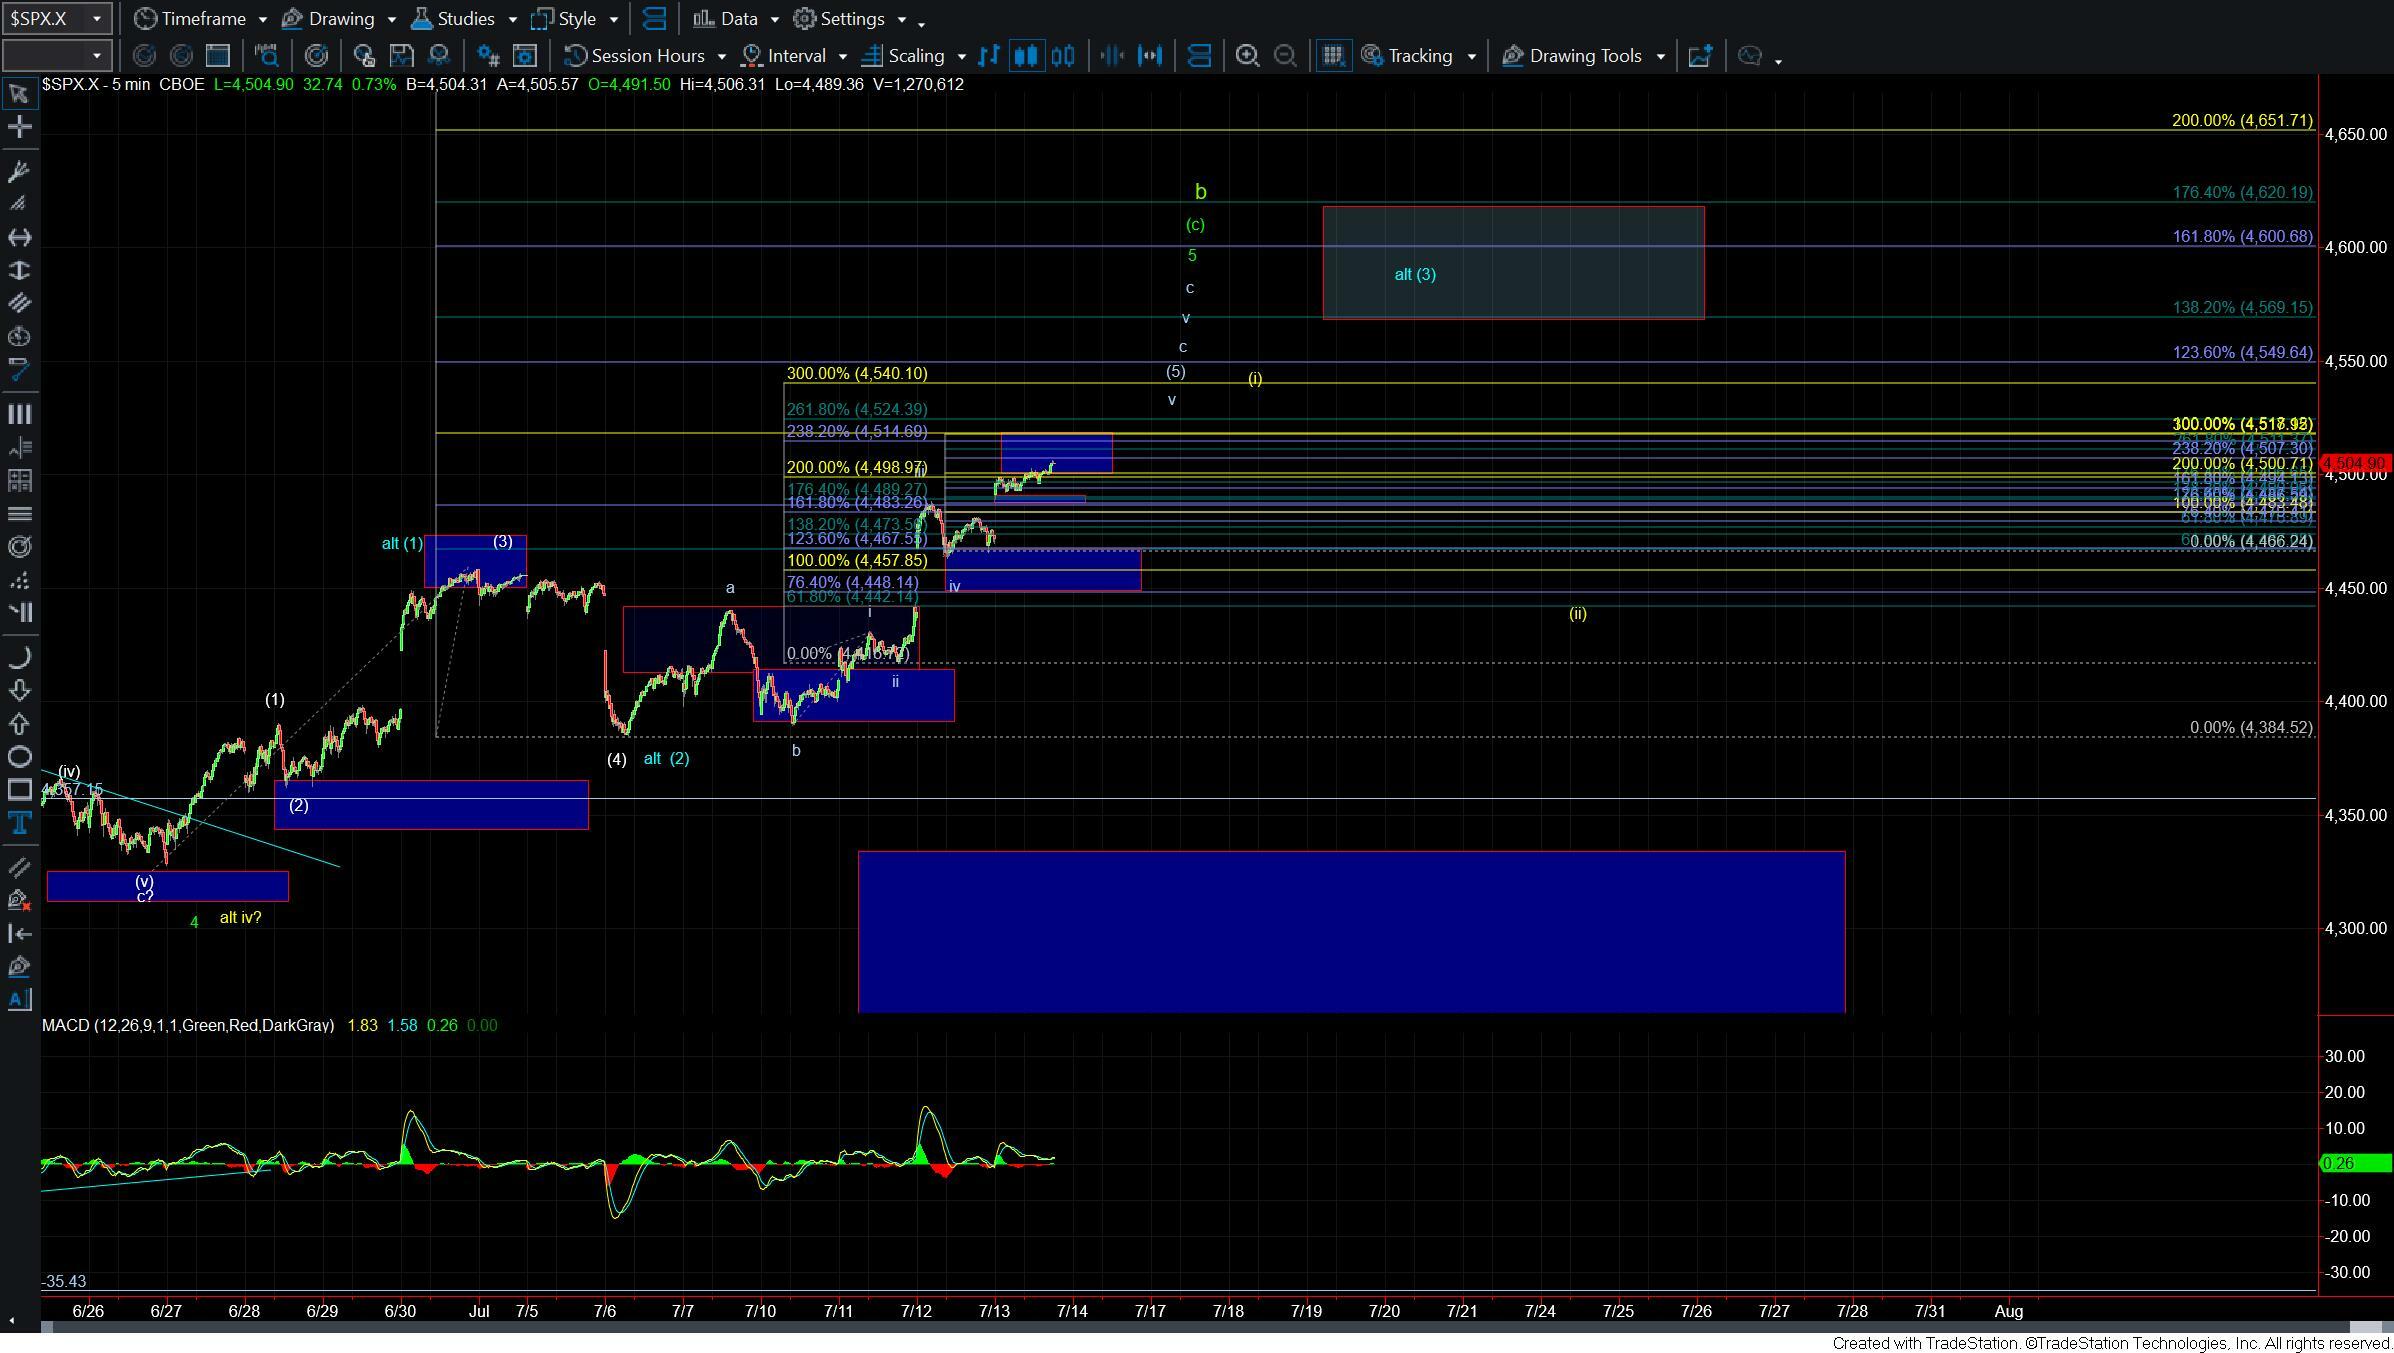
The blue count as shown on the five minute chart is simply a variant of the yellow count and would suggest we are going to see a more immediate breakout. Under this case, we should break fairly directly through the 4516 level and move up towards the 4568-4620 region for a minor degree wave (3) and then hold over the 4518 level upon any pullbacks from there. At this point in time I am still viewing this blue variant as an alternate of even the yellow count but should we begin to break directly through resistance it would certainly open the door to this direct push higher under that yellow count.
RED COUNT
Finally, while certainly less probable with this push higher I am not fully ruling out the red count just yet but it would take a break below the 4332 support level on a three wave move to suggest that this count is increasing in probability. For now it will remain on my radar as an alternate but again the break higher has made it less likely at this point in time.
While the market has continued to grind this is not the spot to get complacent as again I do think we should have a better idea as to what the market's intentions are into 2024 within the next couple of weeks. From here it is just a matter of watching the structure and the price parameters as we have been discussing as we test this key inflection point in the markets.