The Market Continues To Extend As Upper Support Holds
 By
By
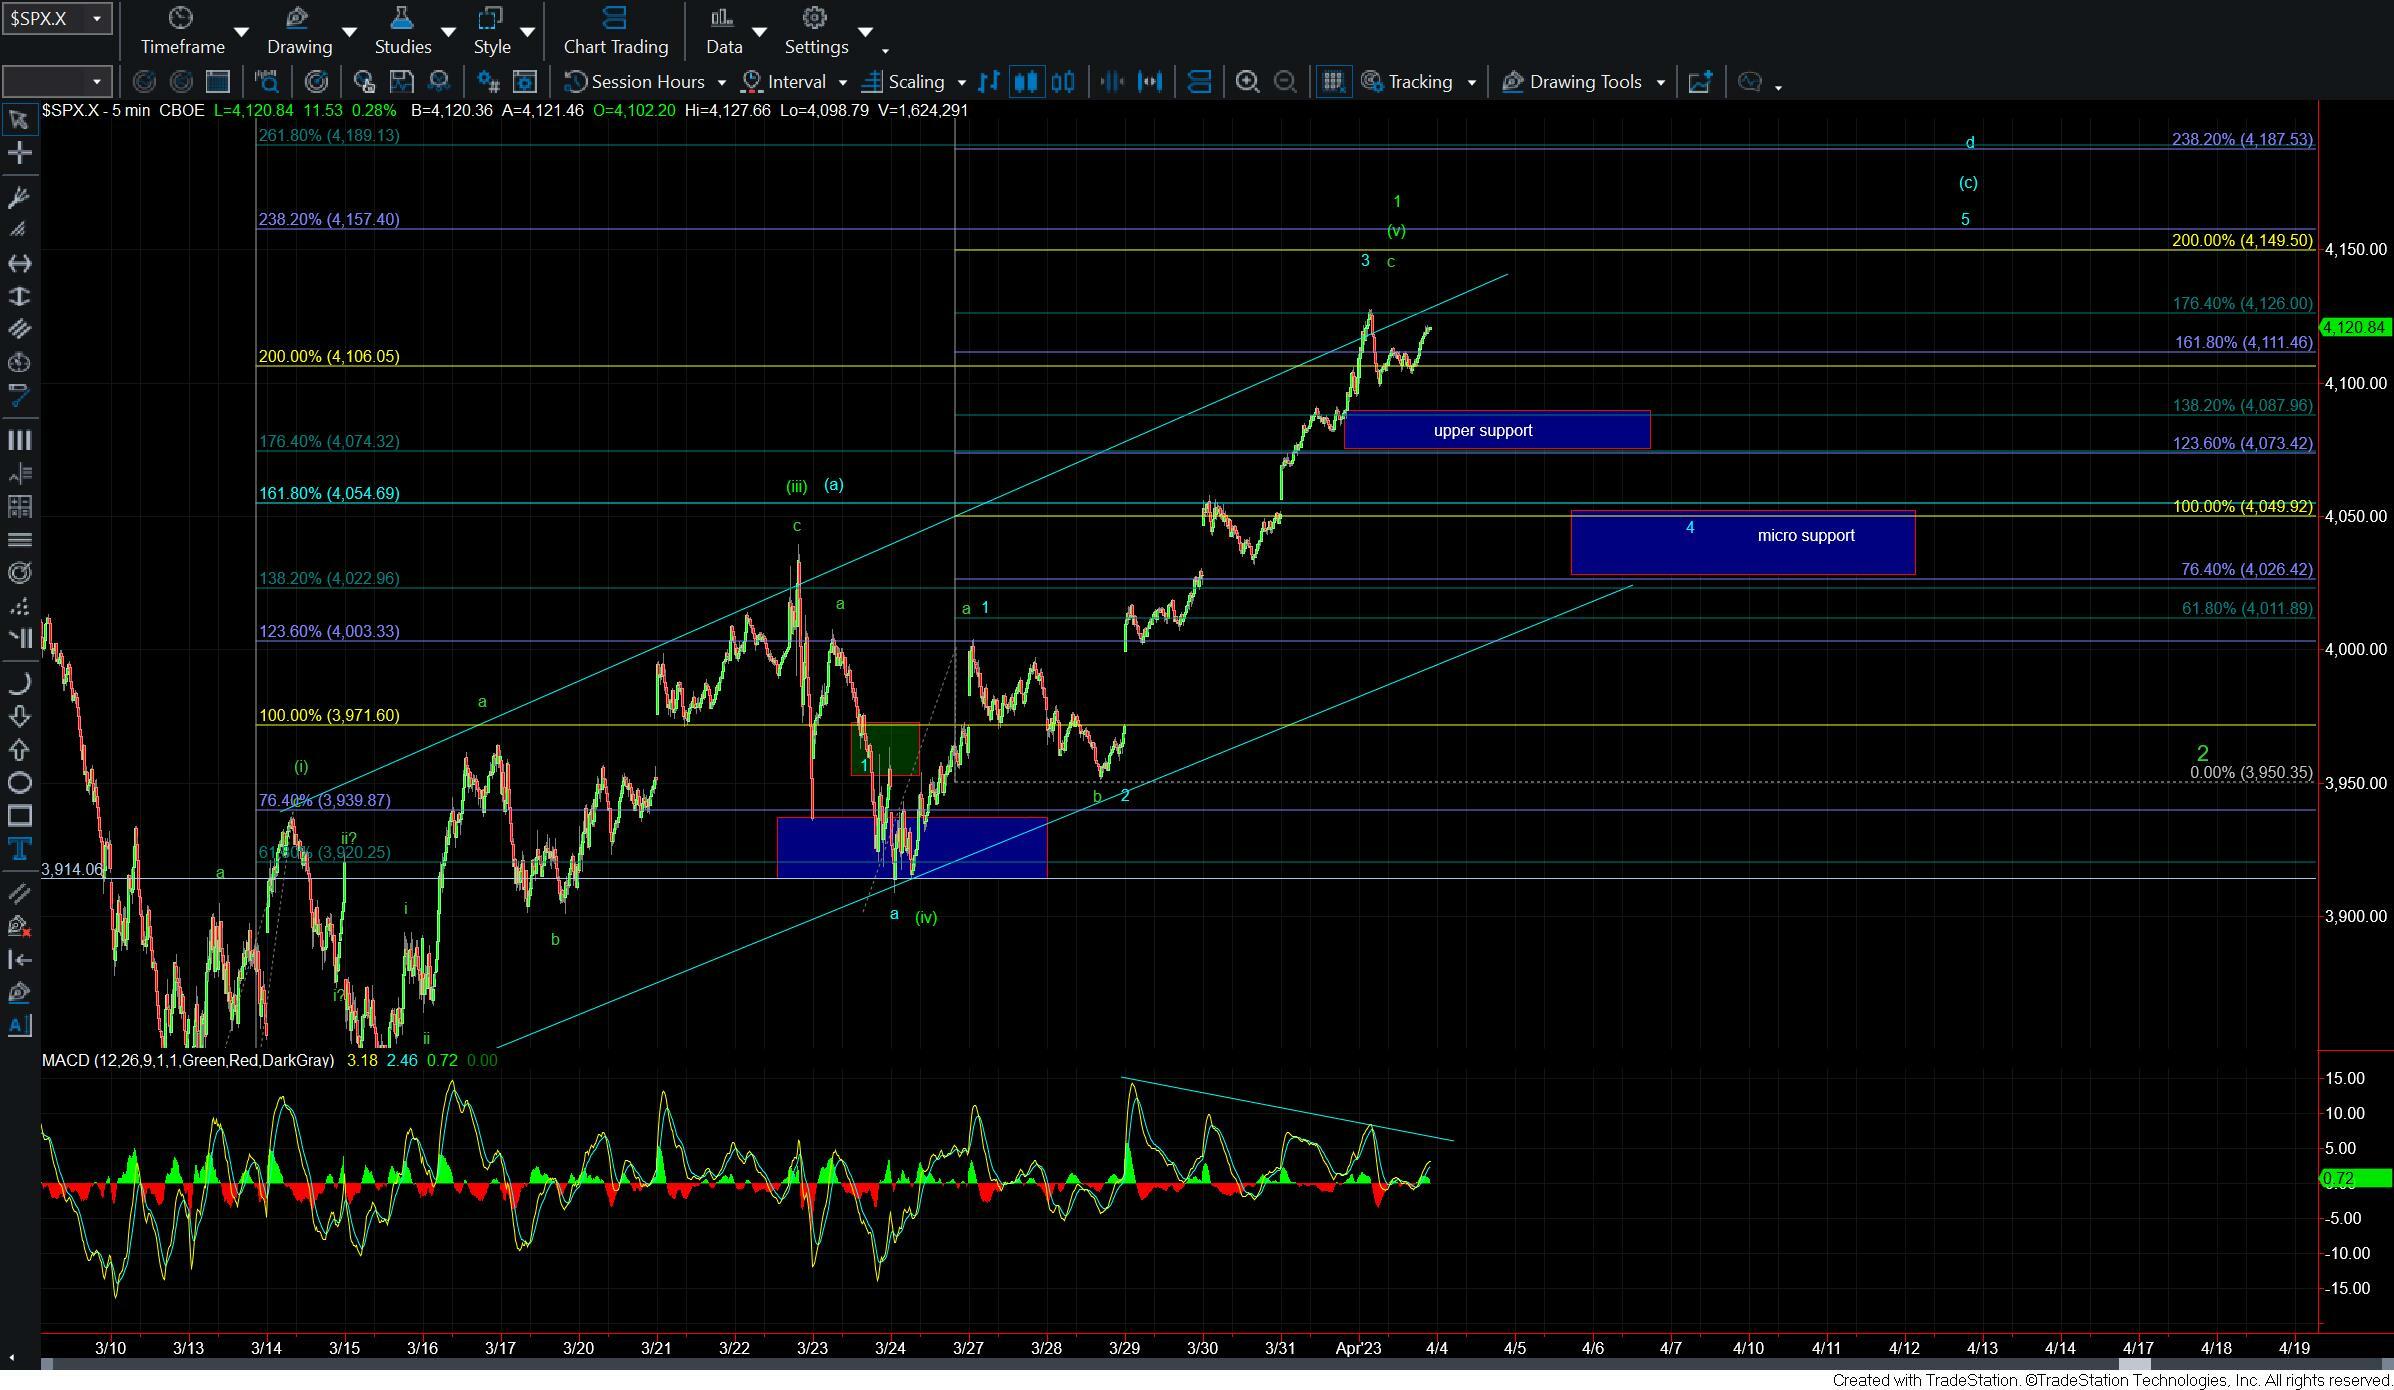
Today we saw the market open higher only to be followed by a fairly sharp pullback in the early part of the session. That pullback however held well over the key support levels that would signal that we have put in a local top and we are trading well off of those early morning lows at the time of this writing. We are however still trading under the high of the day at the 4127 level on what is still counting best as three waves up off of the low of the day. We are also still holding negative divergence on multiple timeframes on the MACD which is supportive of this move to the upside nearing at least a local top. We do however still need to break down below some key support levels to give us the initial signal that we have indeed put in that local top and unless and until that occurs I still can't fully rule out that this will continue to extend higher before finding a top and pulling back.
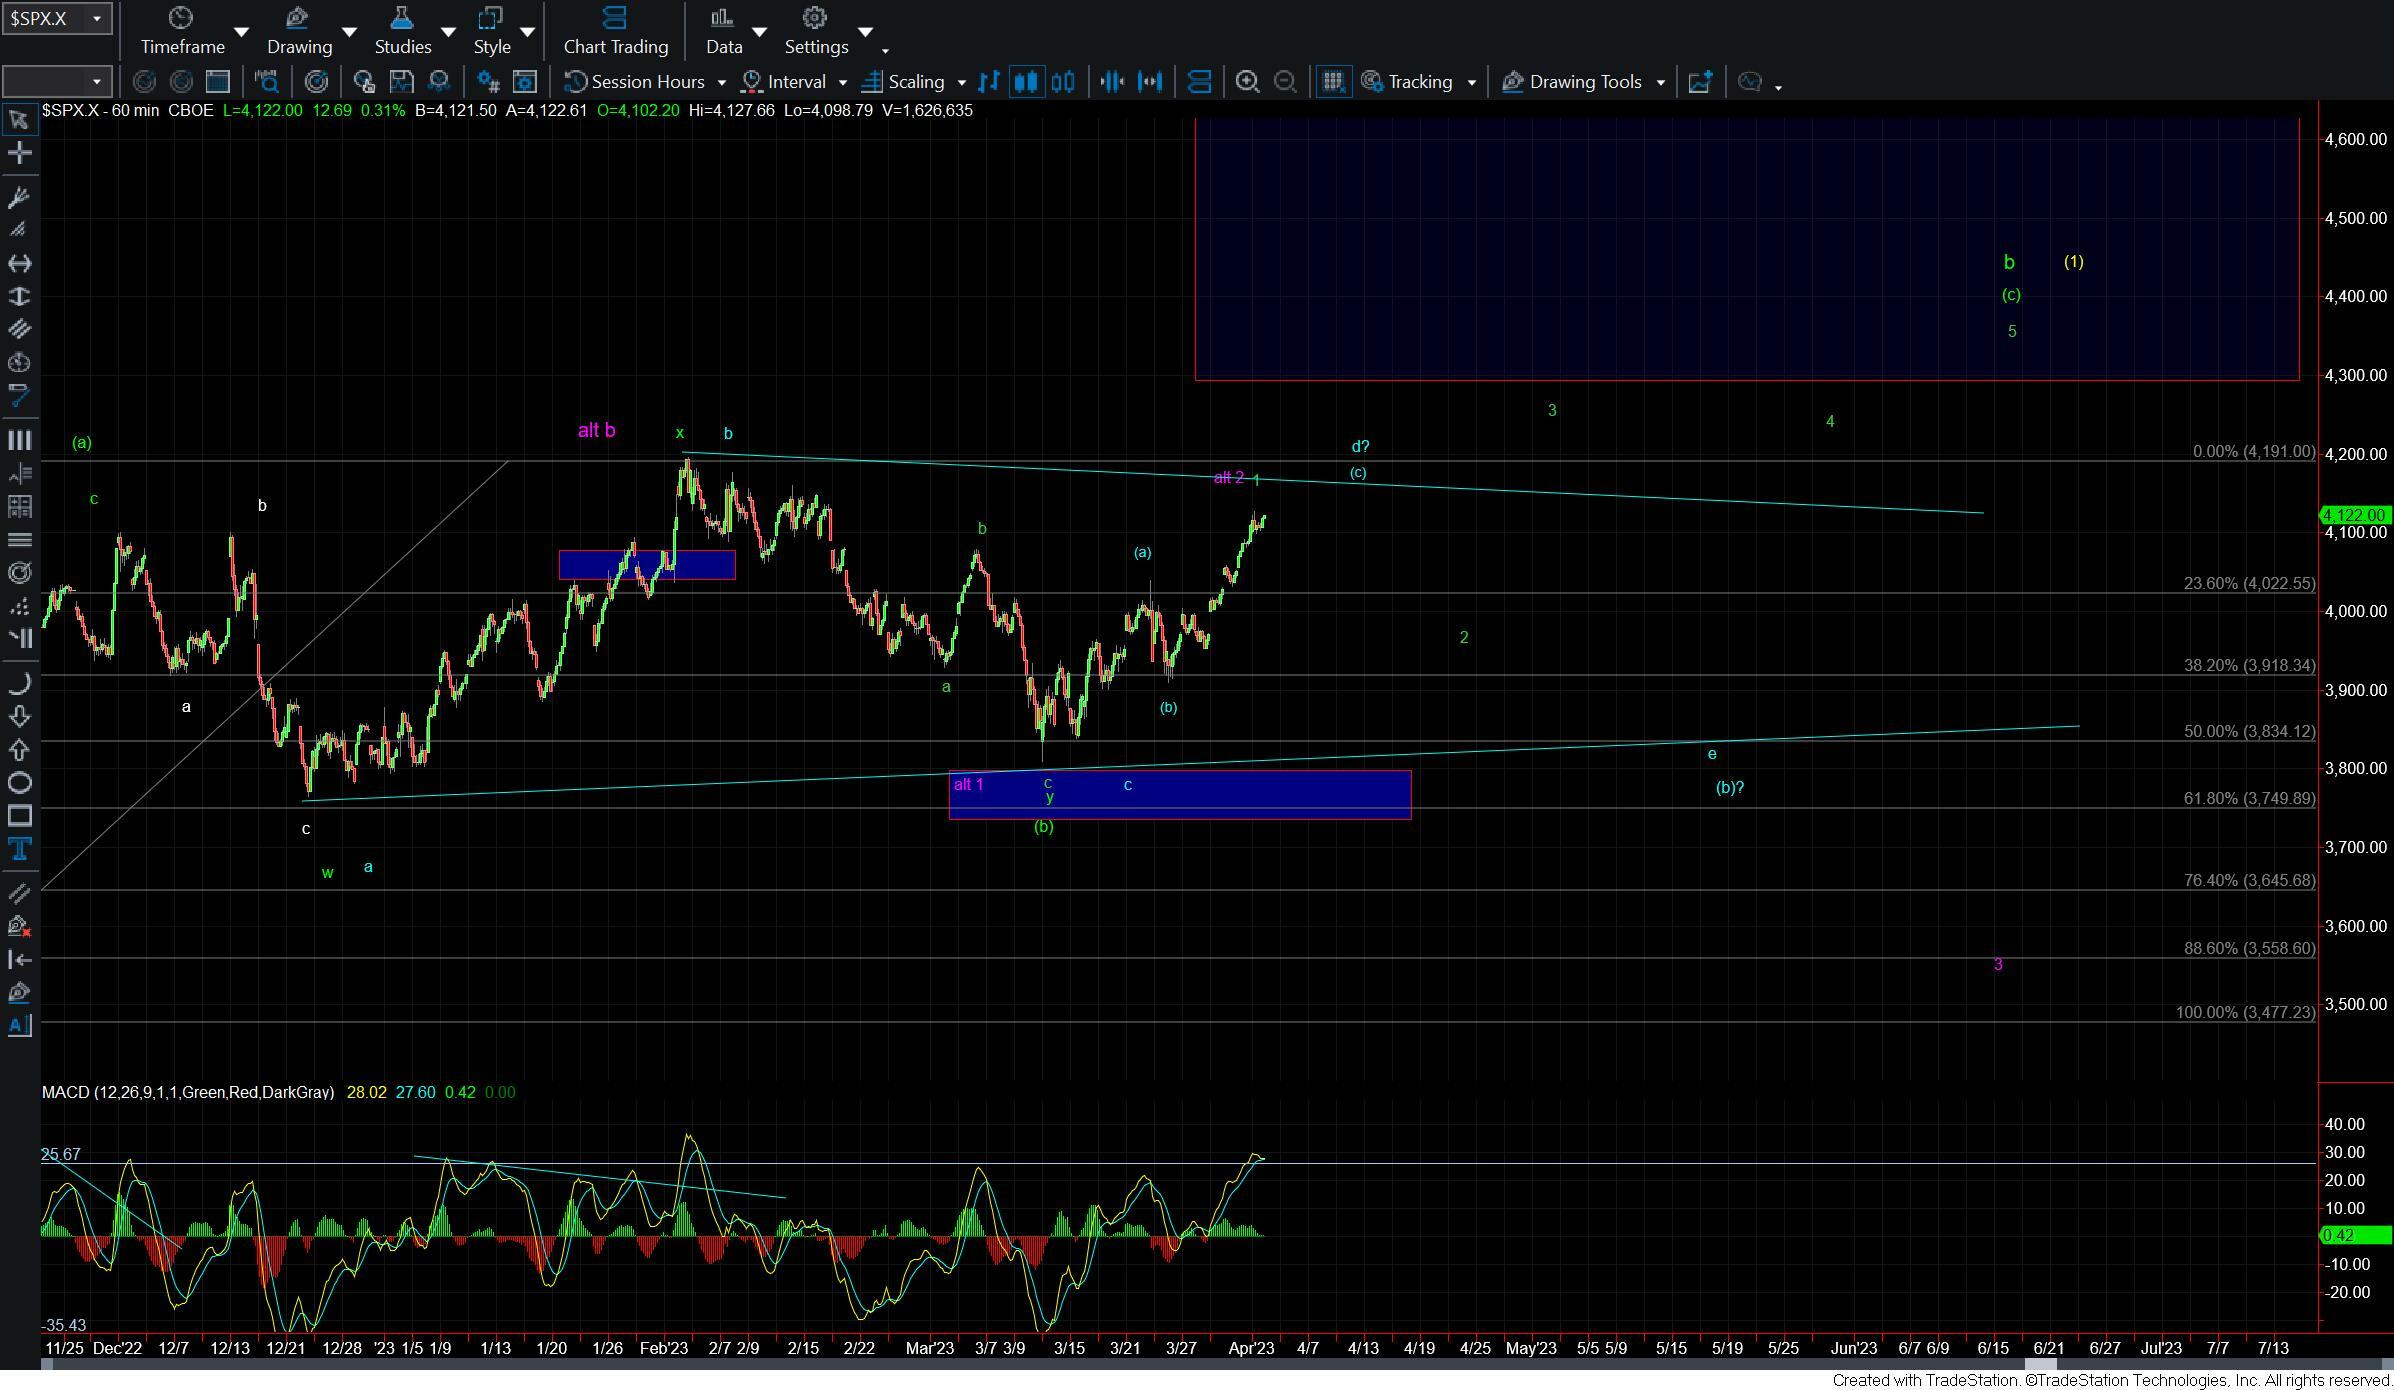
The bigger picture there is not really too much to add to what we have laid out over the past several days and what Avi laid out in detail in his weekend update. The two counts that we are watching are shown in green and blue with the green count being the primary count at this point in time. Under that green count, we should see a top in that wave 1 sooner rather than later as we are running into the upper end of resistance under that count and ideally we should see this hold under the 4149-4157 zone if we do indeed make another higher high.
The first level of support that I am watching to indicate that we have put in at least a local top comes in at the 4087-4073 zone. If we can break through that zone then I would want to see the 4049-4026 zone below broken to eliminate the possibility that we will see another push higher to finish off the wave 5 of (c) of d per the blue count to complete the triangle. Of course once that d wave in the triangle completes we still should see a sizable pullback for the wave e of that triangle before seeing a significant breakout to the upside.
I also want to note that the Russel 2000 does appear to be forming an ending diagonal to finish off this last portion of its move and has already begun to show signs of a local top. So while I do still expect to see higher levels in the weeks ahead in that index I am seeing initial signs of a local top in the Russel 2000. So while I cannot fully rule out seeing the market continue to extend a bit higher here we are getting quite extended and there are now several indications on multiple fronts that we are nearing a local top in the short term and are due for a pullback. The depth and structure of that pullback is still a bit more up in the air at this point in time, however, it should help give us further guidance as to where the market is heading in the weeks ahead.