The Issues In The Futures Continue
 By
Avi Gilburt
Not only did the futures get a higher high last week in the b-wave, but we have now made a lower low in the futures, which has also not been seen in the SPX cash index. At least not yet. So, I am trying to figure out how to synthesize the structures and how to interpret them in a way that is consistent and in which they can potentially align.
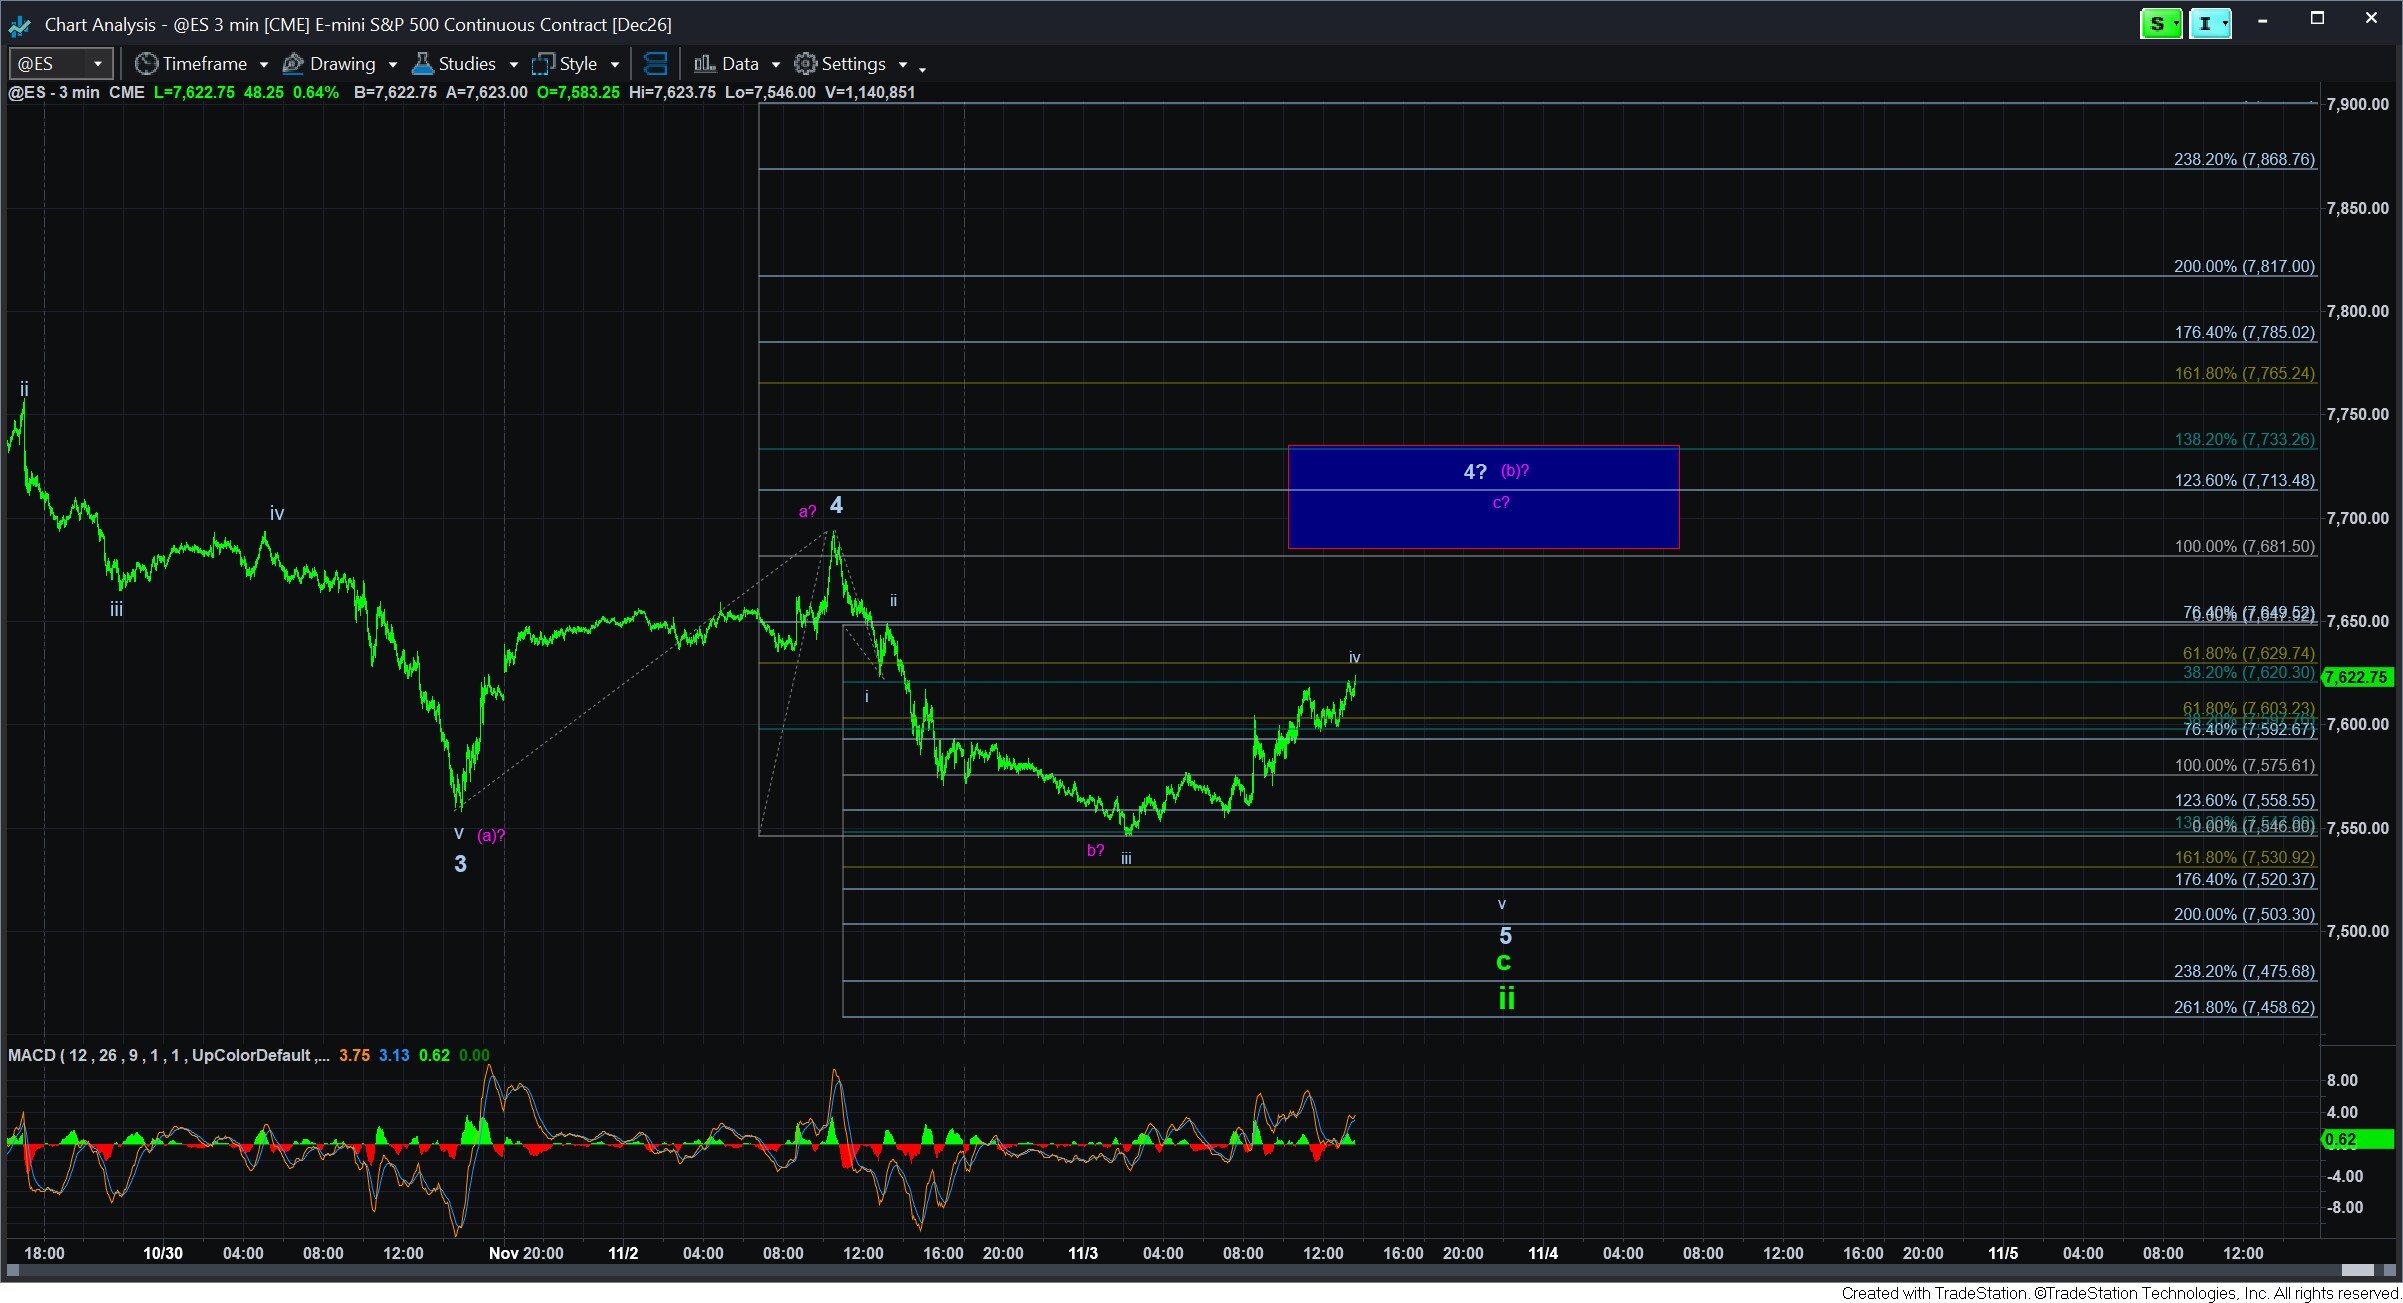
There are two paths I outlined today which can align both the futures and the SPX. That is presented on the attached ES chart.
The first path would consider today’s bounce a wave iv in an ending diagonal for wave 5 of c of ii. That means we should begin a decline pretty soon to a lower low, with an ideal target around 7520ES. This count invalidates should we move over the wave ii high.
The other path is presented in purple. And, the reason it is in purple is that it is not fully a red count which would suggest a major top is in place. I think it is a bit early to make that assumption for the reasons I have set forth in prior analysis. But, this purple count can actually fill in two counts which still present as a bigger wave ii in green.
The first is that this can represent a bigger 4th wave in an expanded flat, suggesting we can still drop down to the 7500SPX region to complete the c-wave of wave ii in green. This path would likely hold support over the .618 retracement of wave i, which is the 7469SPX region.
The other can represent a bigger (a)(b)(c) in wave ii, and which can potentially take us down to the .764 retracement of wave i in the 7380SPX region (and maybe even a bit deeper). But, both of these paths can still maintain a wave ii in green wave count.
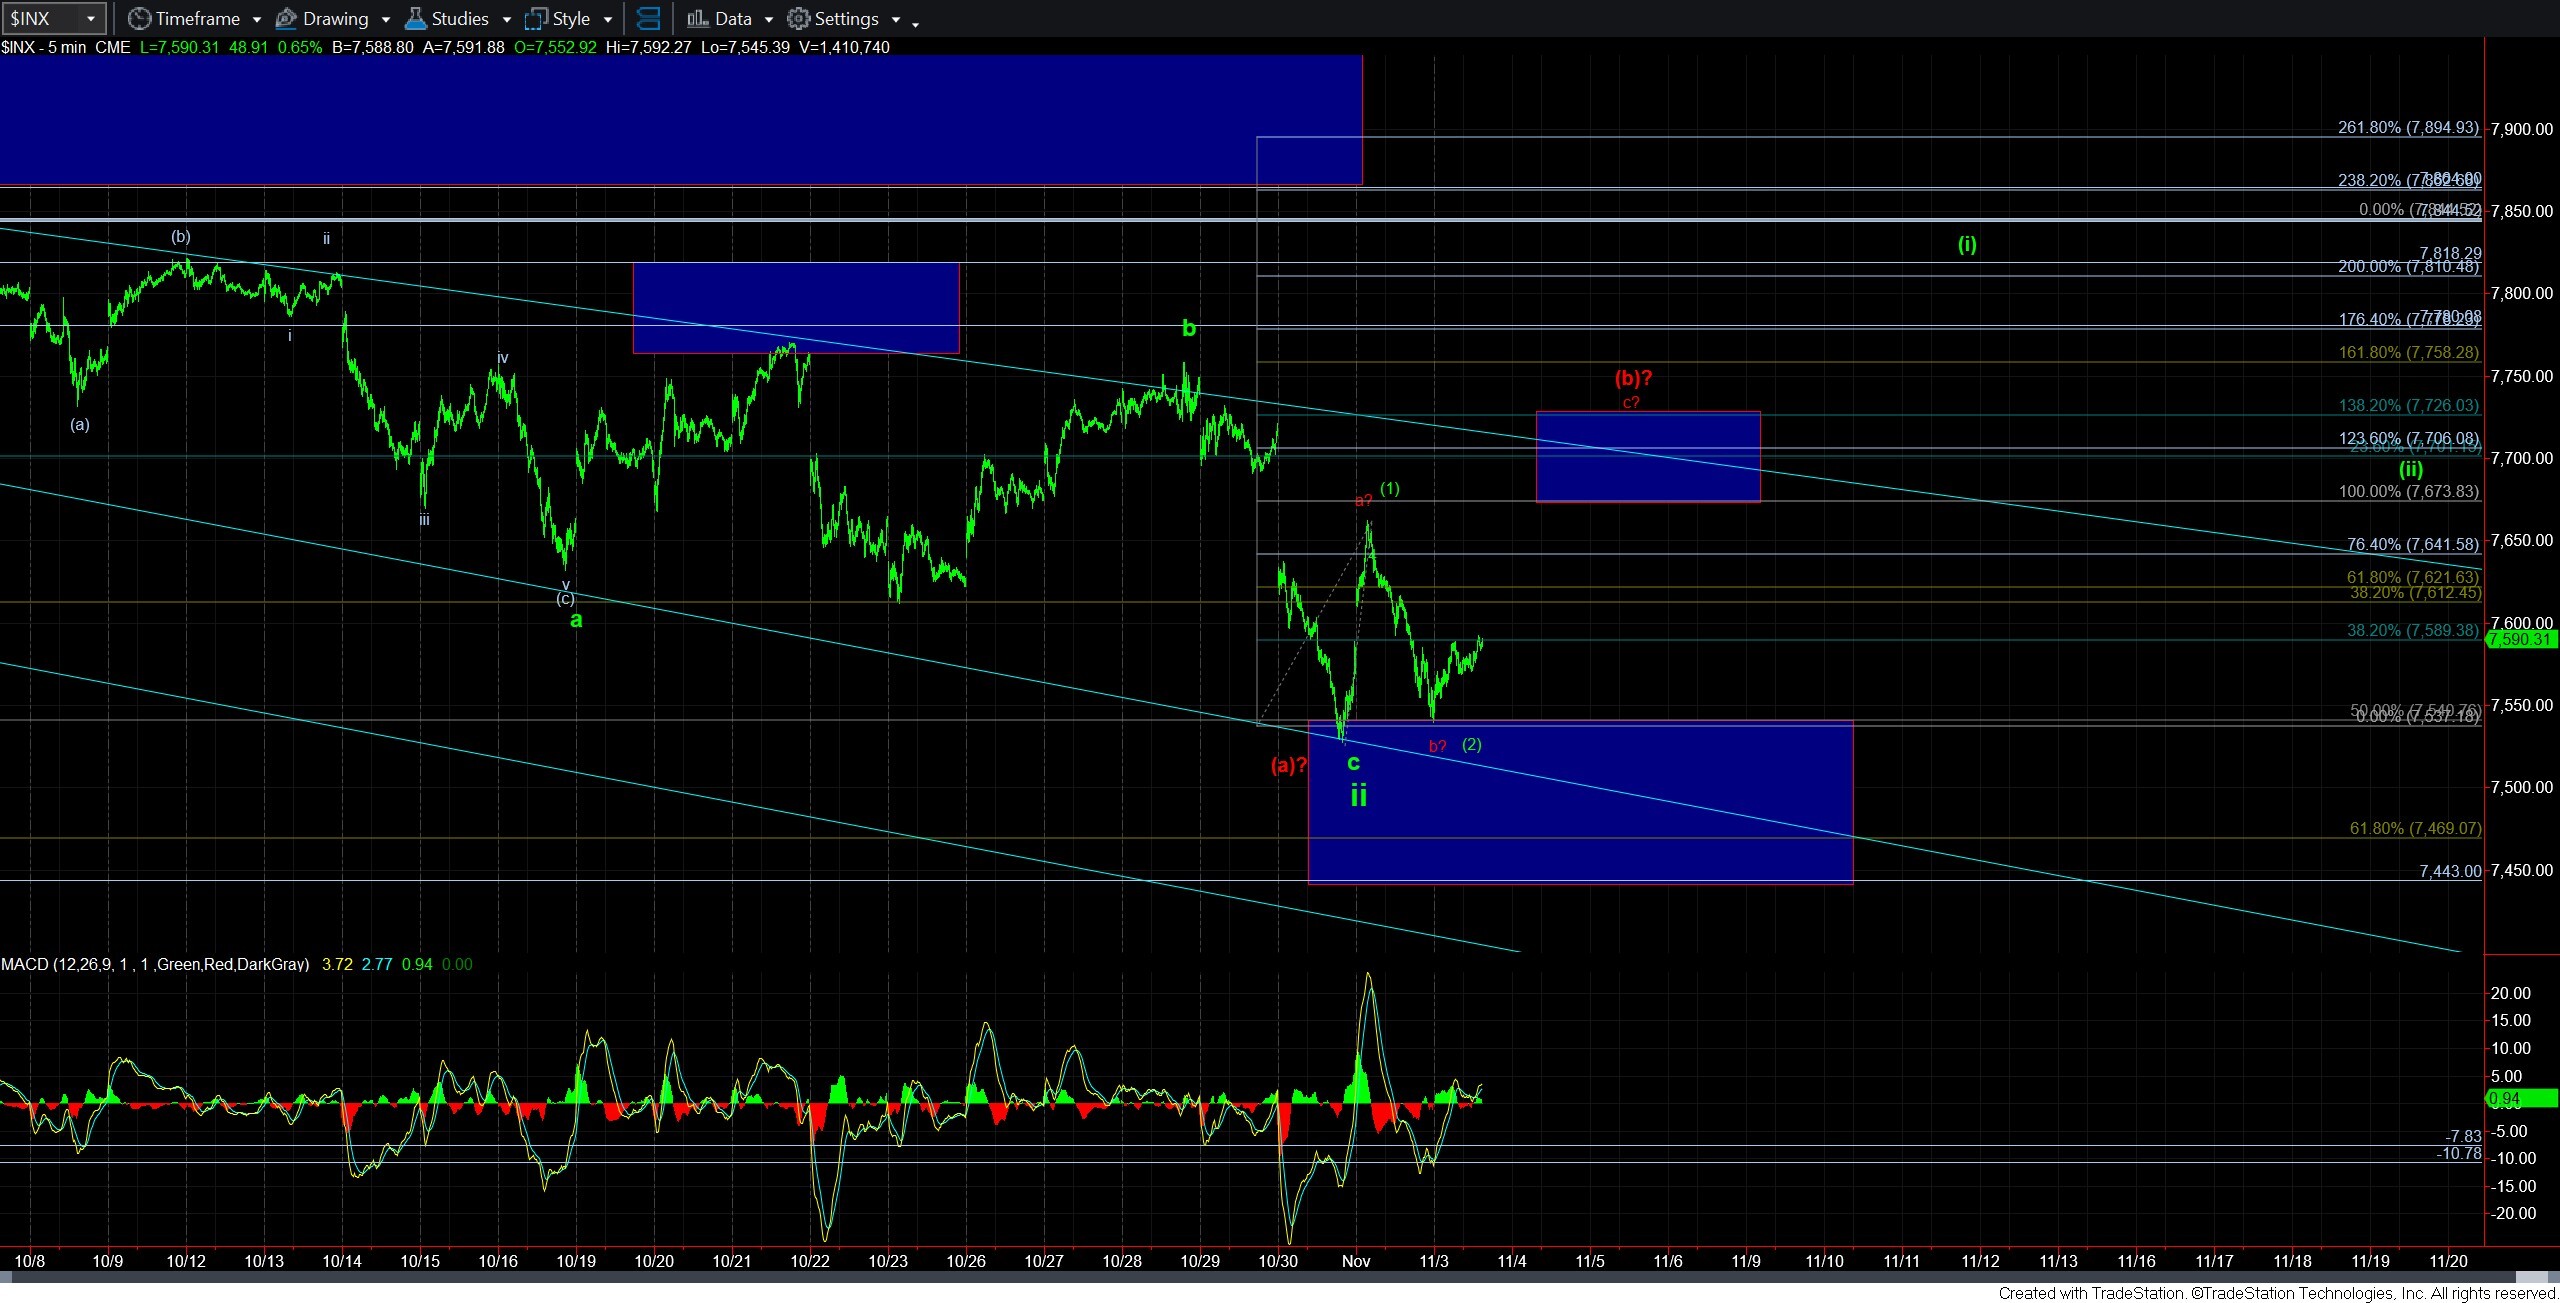
Of course, if the market can push past the resistance boxes overhead on the ES and SPX chart, then maybe wave ii can have been proven to be completed, and we could then get a (i)(ii) upside bullish set up develop as per the larger green count. That is being presented on the SPX 5-minute chart. But, at this time, I think the market has a lot to prove for that potential, as that is seemingly a lesser likely immediate path at this time based upon the current action. It simply does not well align with the futures structure.
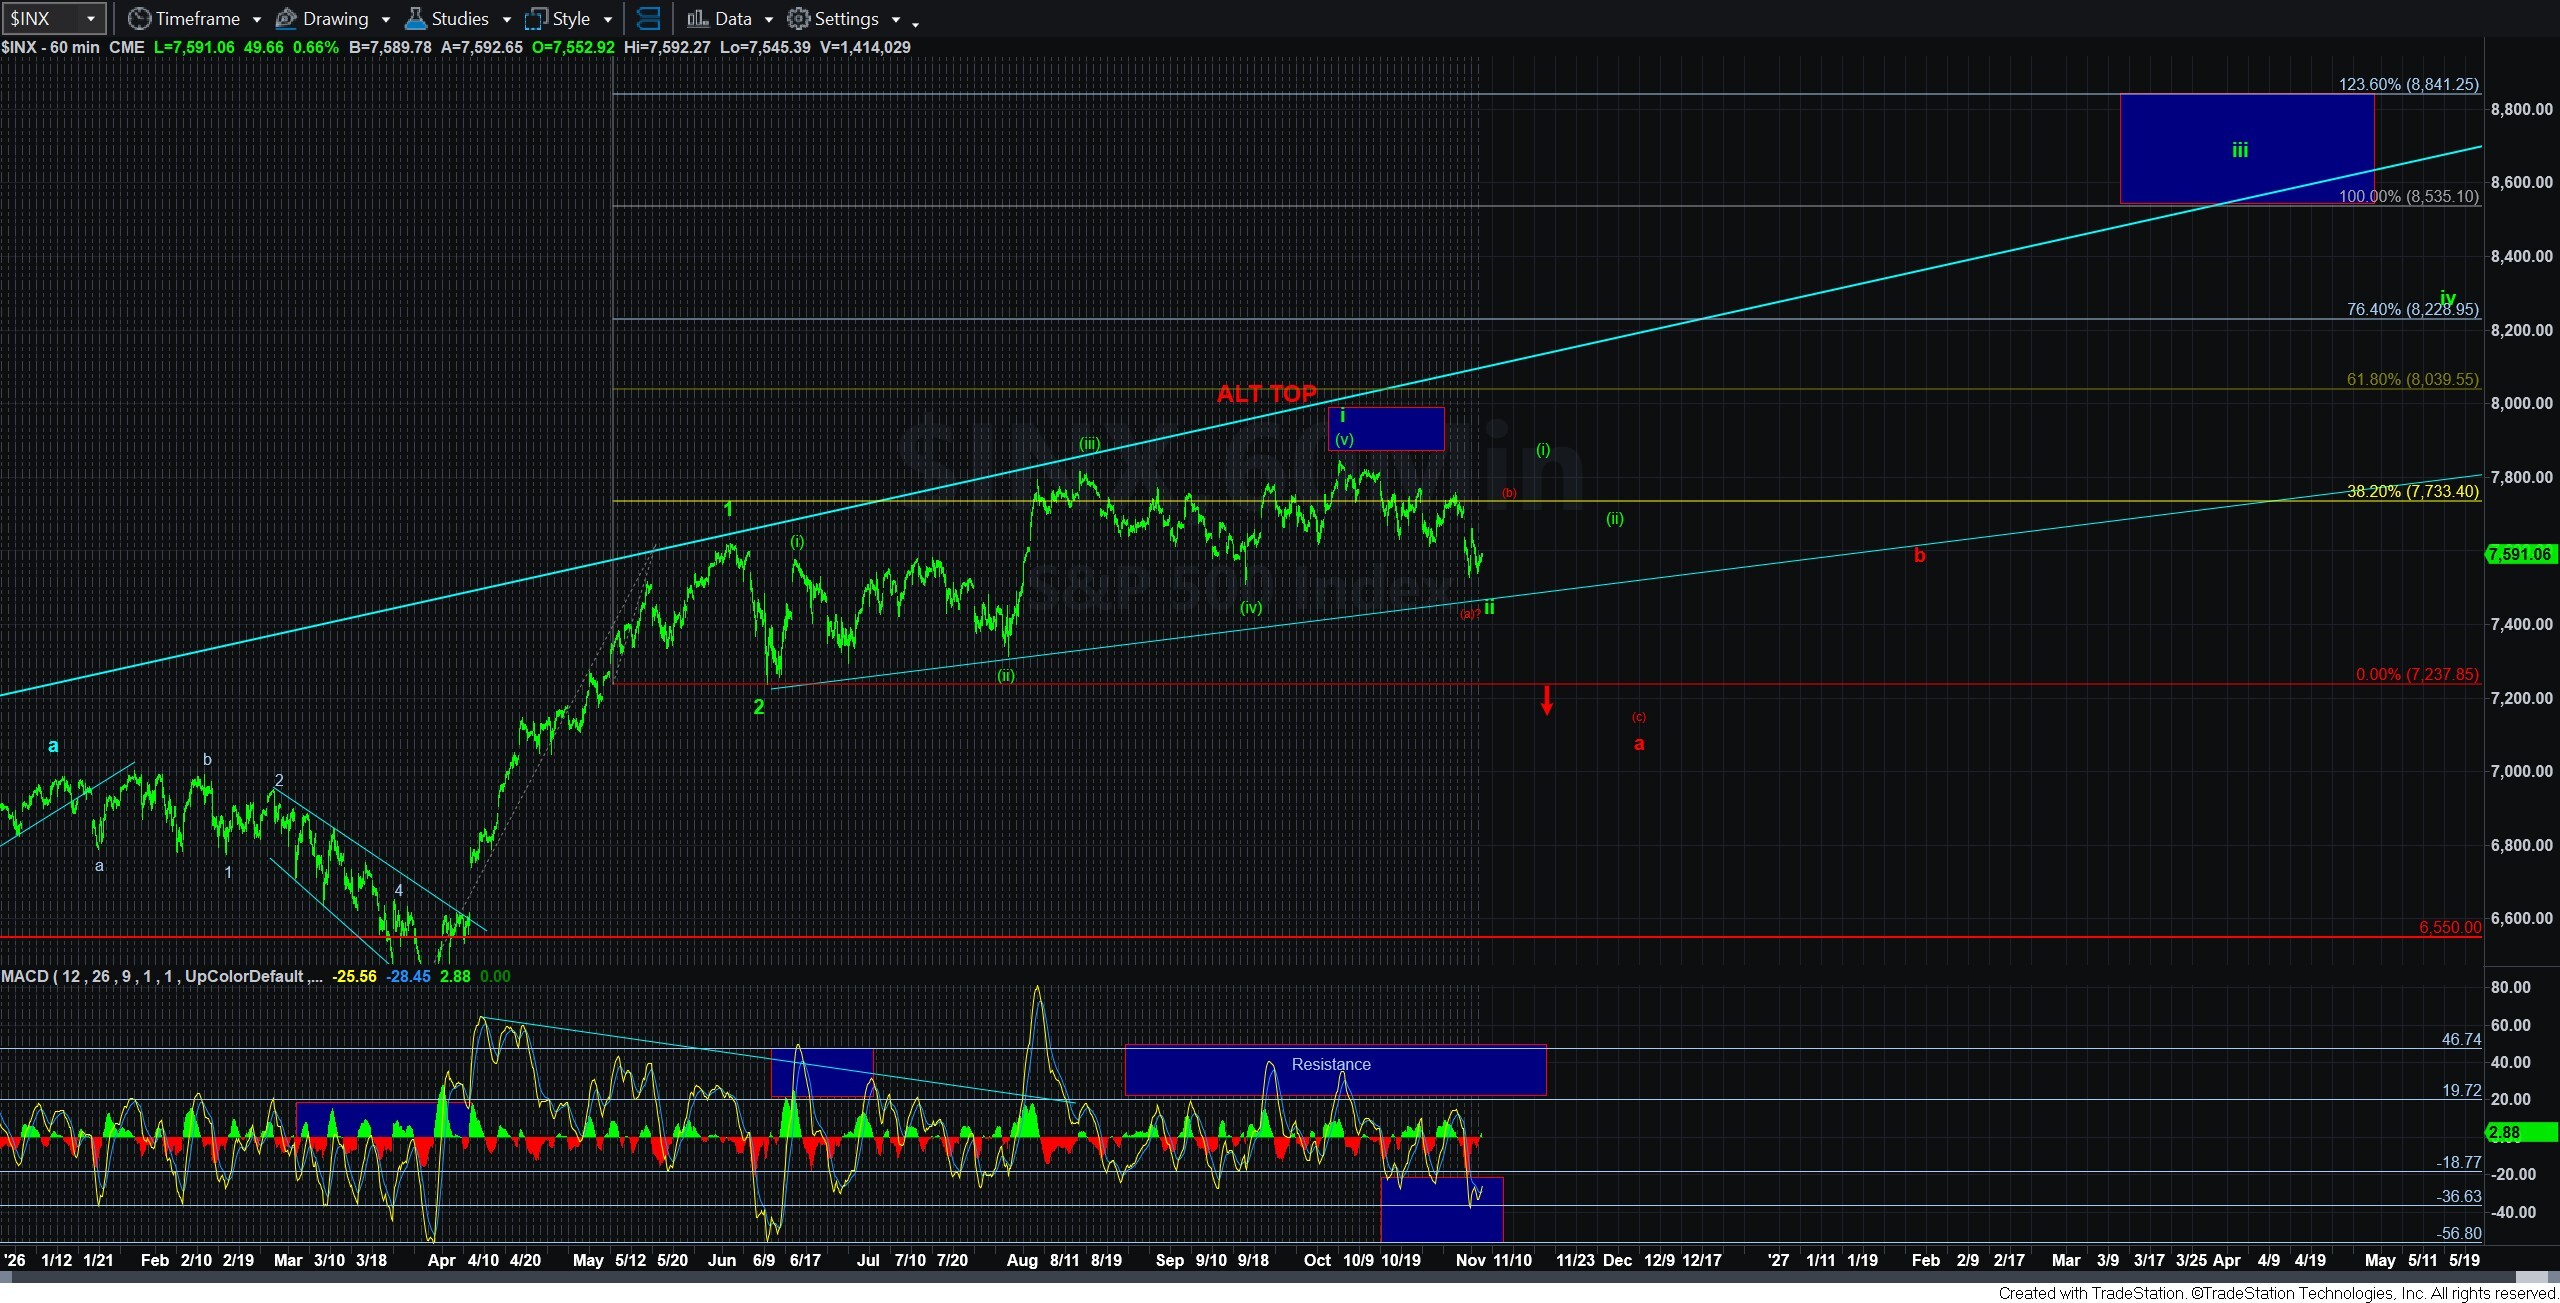
Of course, the purple count can also represent the red top-is-in count, but that cannot be confirmed until we get a break of 7237SPX.
So, with the machinations we are currently seeing, and in taking all the evidence into account, it makes the more immediate green path less likely in my eyes, with the potential for this wave ii to still strike at least one more lower low before we may have a wave ii completed. So, for now, I cannot be confidently bullish in the immediate sense as long as we remain below the resistance boxes noted on the ES and SPX charts.
In the bigger picture, there are still two main points you have to weigh. First, until the market breaks the 7237SPX level, we have no clear indications that a major top may have been struck already. And, second, this is a VERY mature bull market, especially when we consider that we are attempting to complete a multi-decade 3rd wave which began in 1932.
These two factors have to always be weighed when making decisions about how you want to be positioned as we go into the end of the year and potentially beyond. But, at this time, there is no CLEAR indication yet a major top has been struck, and until that happens, we have to respect the potential for one more bullish set up.
In the shorter term time frame, we will need to be a bit more patient until the market eventually resolves these issues as outlined above.