The IWM Is Leading The Way
When the IWM invalidated its downside pattern, it began to take the lead in the markets, and started pointing us higher. In fact, thus far, the IWM is following the guideposts of Fibonacci Pinball rather well. Yet, I cannot say that the structure has been ideal. And, for this reason, I must stay on my toes.
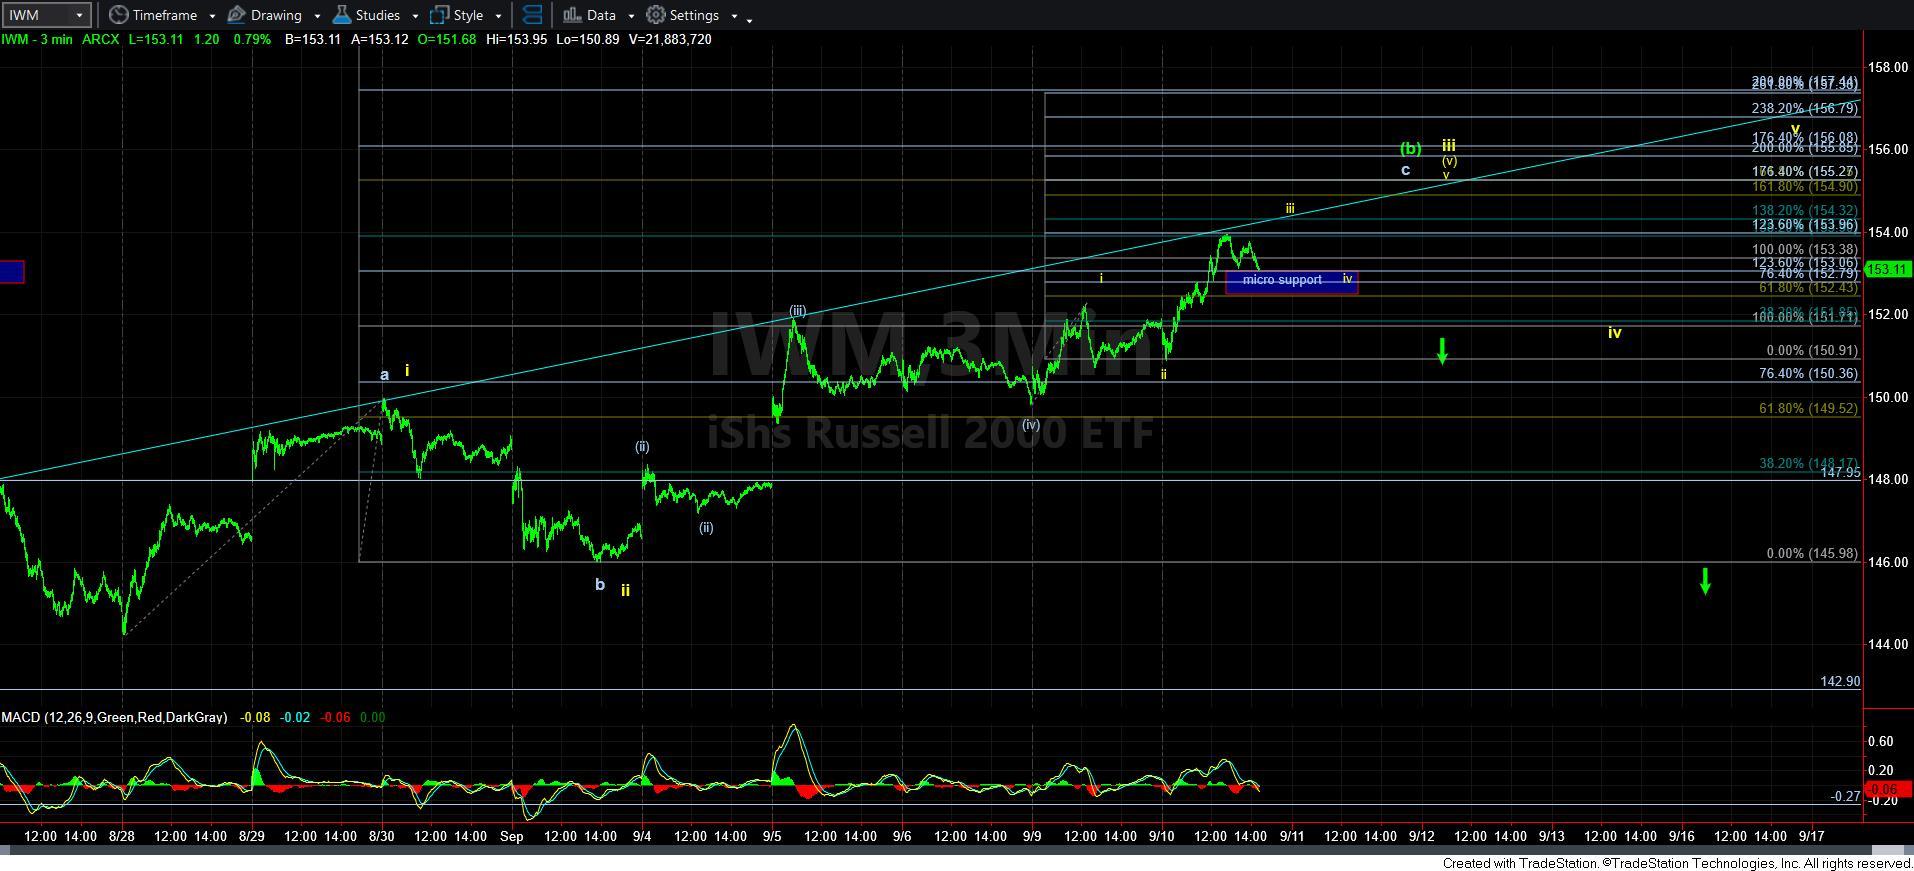
So, let’s look at the detail count on the 3-minute chart so we all know what to be looking for in the coming days.
When zooming in on the micro structure as I write this update, as long as the IWM remains over the 152.40-151.75 support region, then we should push higher one more time to complete wave iii of (v) of iii or c of (b) on this chart.
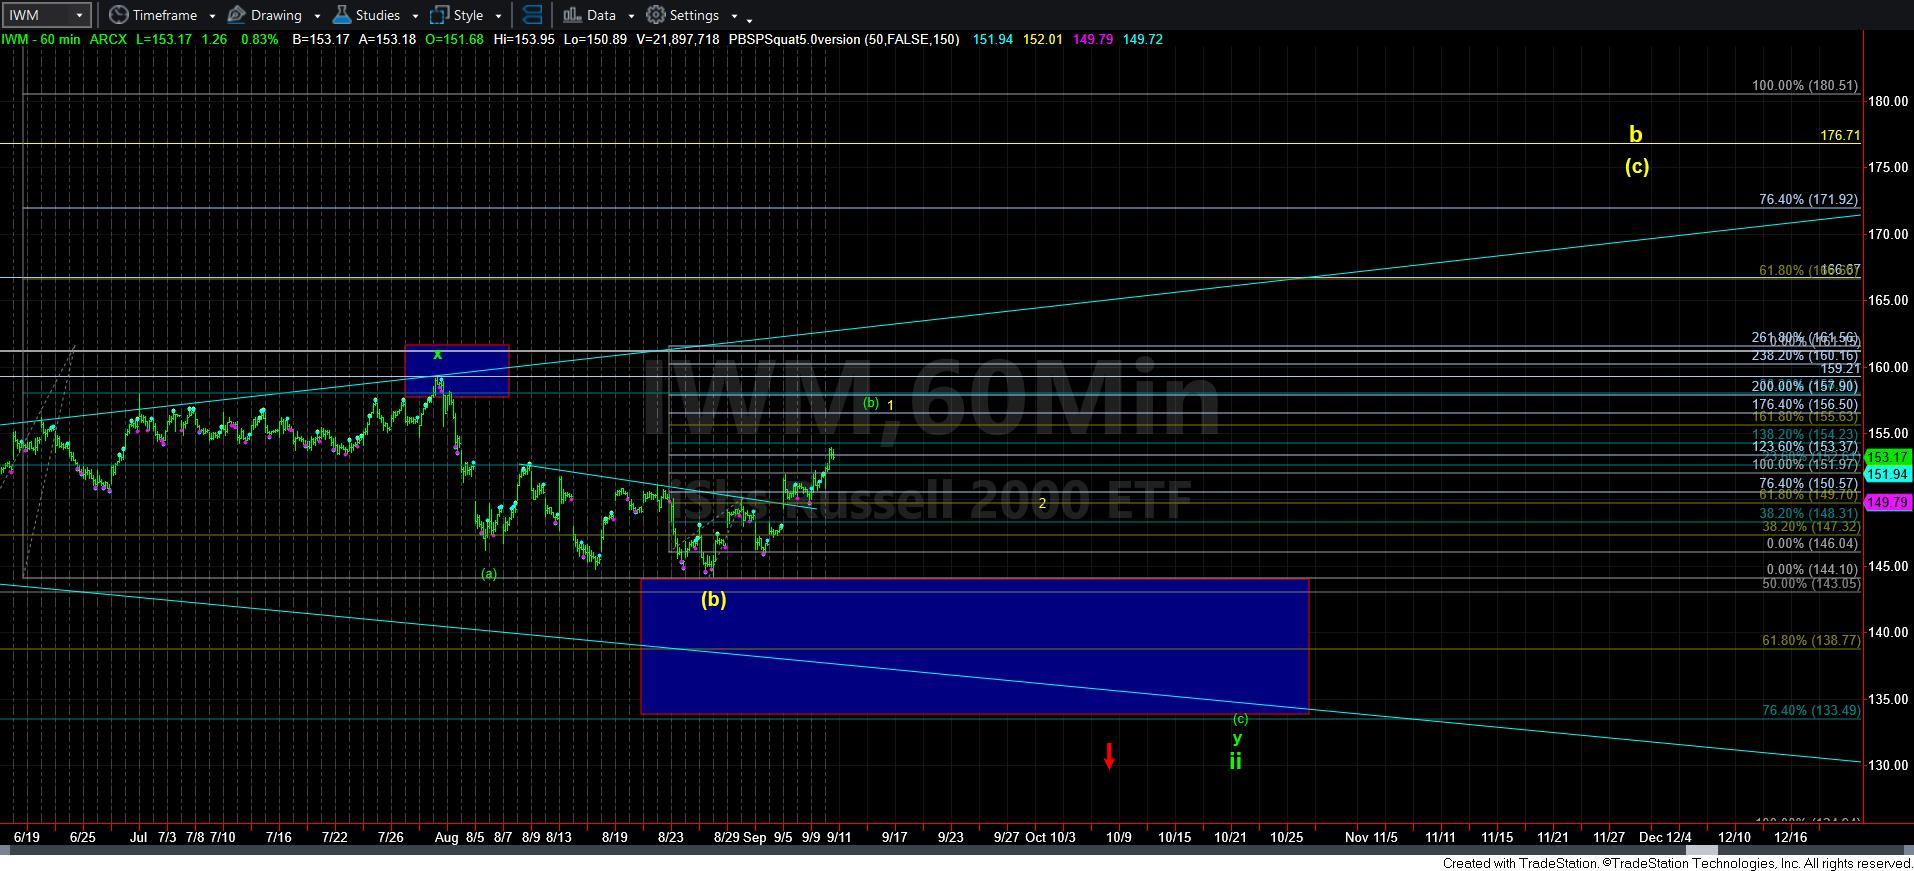
The question then becomes how do we know the difference between the [b] wave potential topping or the more bullish yellow count pointing us to 170+ on the 60 minute chart?
Well, the answer really lies in what the IWM does once it strikes a top. And, there are two potential topping points for the IWM. The more immediate top can come when this current 5 wave structure completes into the 155 region, which can complete all of the c-wave of this [b] wave. The other potential is a more complete 5-wave structure which pulls back to the 151.70/152 region after striking the 155 region, and then continues higher one more time in wave v in yellow towards the 156 region. Either of those structures can represent the top to the IWM for this [b] wave rally I am tracking.
However, once we do strike that top, and the IWM breaks initial support, it MUST provide us with an impulsive 5-wave structure off that high to strongly suggest that we are going to drop in the [c] within my primary wave count. If the market drops in a clearly corrective manner and then takes out the high struck in the 156 region after that corrective pullback, then it likely means we are going to the 170+ region in the larger [b] wave in yellow on the 60-minute chart.
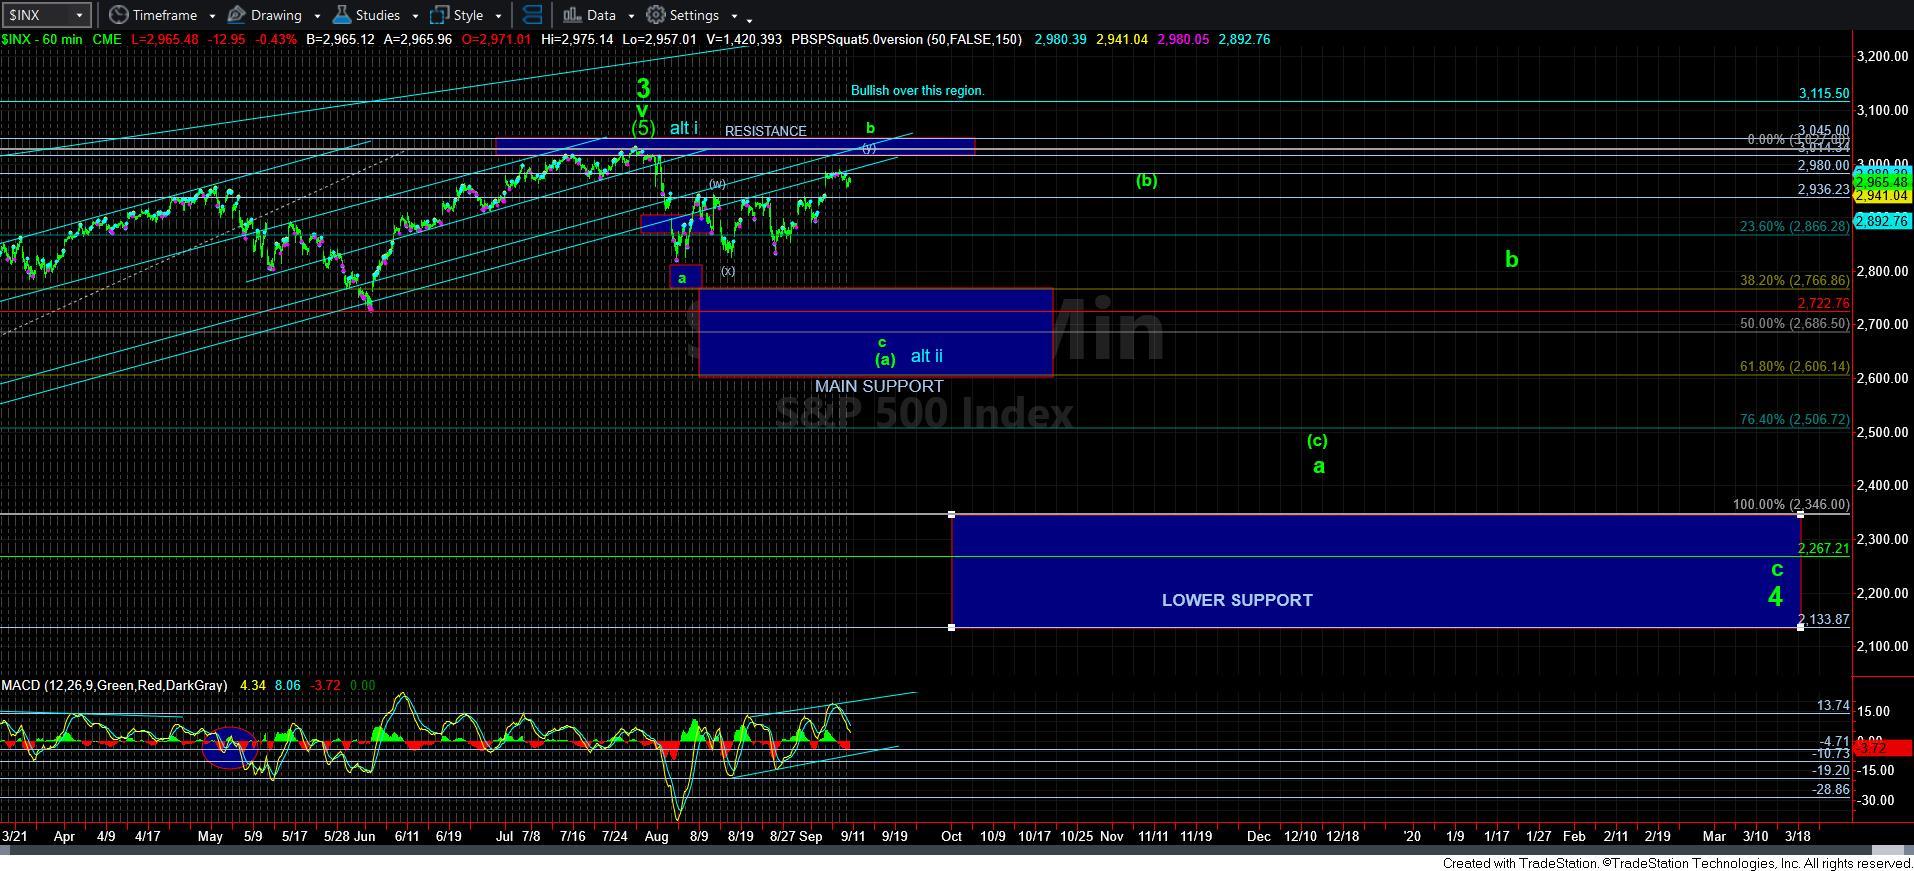
While my expectation remains that the IWM will likely continue to outperform the SPX as it chugs higher, in the alternative structure pointing the IWM to the 170+ region, it becomes highlighly likely that the SPX will see a higher all-time high. Yet, even in that scenario, I really don’t think we are have begun the rally to 3800-4100SPX just yet. Rather, I think it will simply be another expanded b-wave structure. Yet, a strong move through the 3115SPX region would clearly force my hand regarding that larger pattern pointing higher. For now, my expectation remains to see levels below 2700 in the SPX before we break out over the 3115SPX resistance region.
In summary, until the IWM is able to confirm it has topped prematurely, or until it completes waves iii, iv and v in yellow, I have no indications that the equity market has indeed topped. So, I will bide my time before I become bearish and will allow the IWM to lead the way.