The Honey-badger b-Wave
I am going to take a step back to review what has worked since this 4th wave began in the fall of 2018, and what has not.
It was quite clear that our warning of a break of 2880SPX opened the door to this 4th wave having begun, especially when it seemed like most others were caught by surprise. And, today, we still remain below that region.
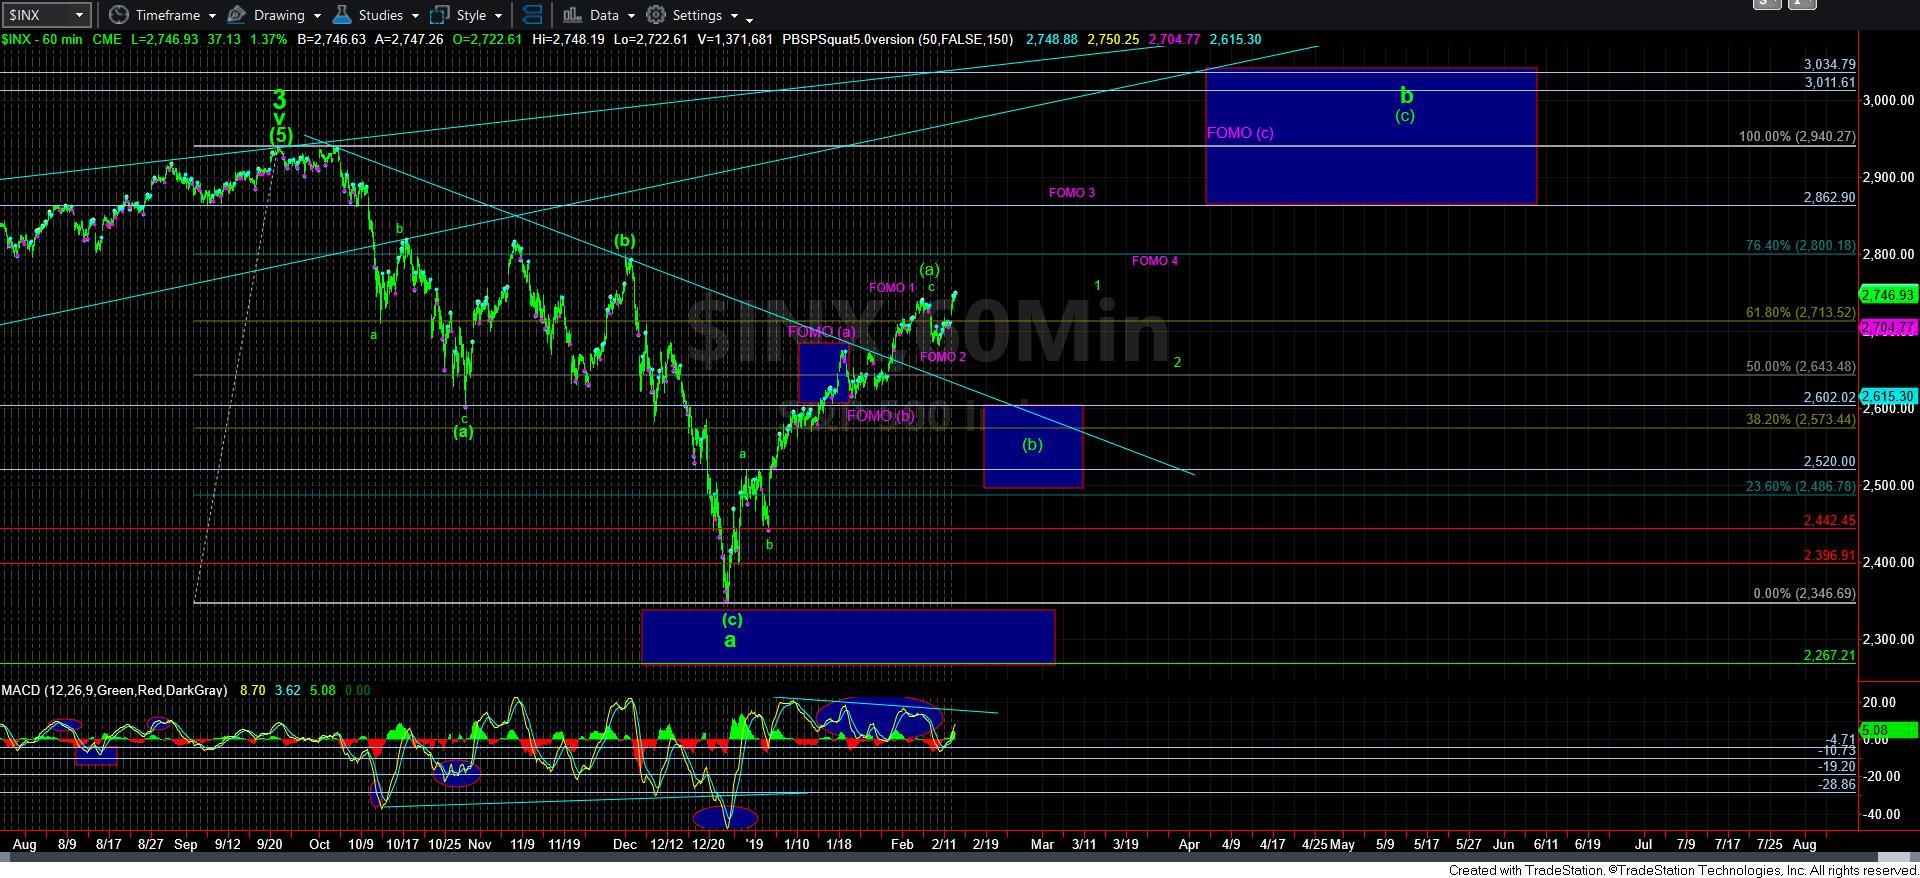
Moreover, once we began breaking down below 2800SPX in December, we set a downside target for the a-wave in the 2250-2335SPX region. The futures market hit our target with a low of 2316, and turned back up, as we called for that night we struck the low. Once we bottomed, we expected a 150-200 point rally back to the 2470-2520SPX region.
However, the manner in which the futures bottomed had us expecting the rally to 2470-2520 to be a 4th wave rally since we did not complete a 5-wave c-wave structure into the 2316 lows. However, when the market pulled back from 2520SPX, I began warning our members that it looked like a corrective b-wave, rather than a set up for a lower drop, which had me potentially looking higher to 2600+ from the 2450 region.
But, even before the market began this b-wave rally, we had our b-wave target set with a minimum of 2800SPX, with the potential to extend as high as the 3011-40 region, the reasons for which I explained in great detail in prior evening and weekend updates.
So, from that perspective, no one should be surprised that we have almost reached the minimum target we had for this b-wave rally, which was set even before we completed the a-wave bottoming. The point which has not met our expectations is the direct movement towards that target, which is not normally seen in this manner.
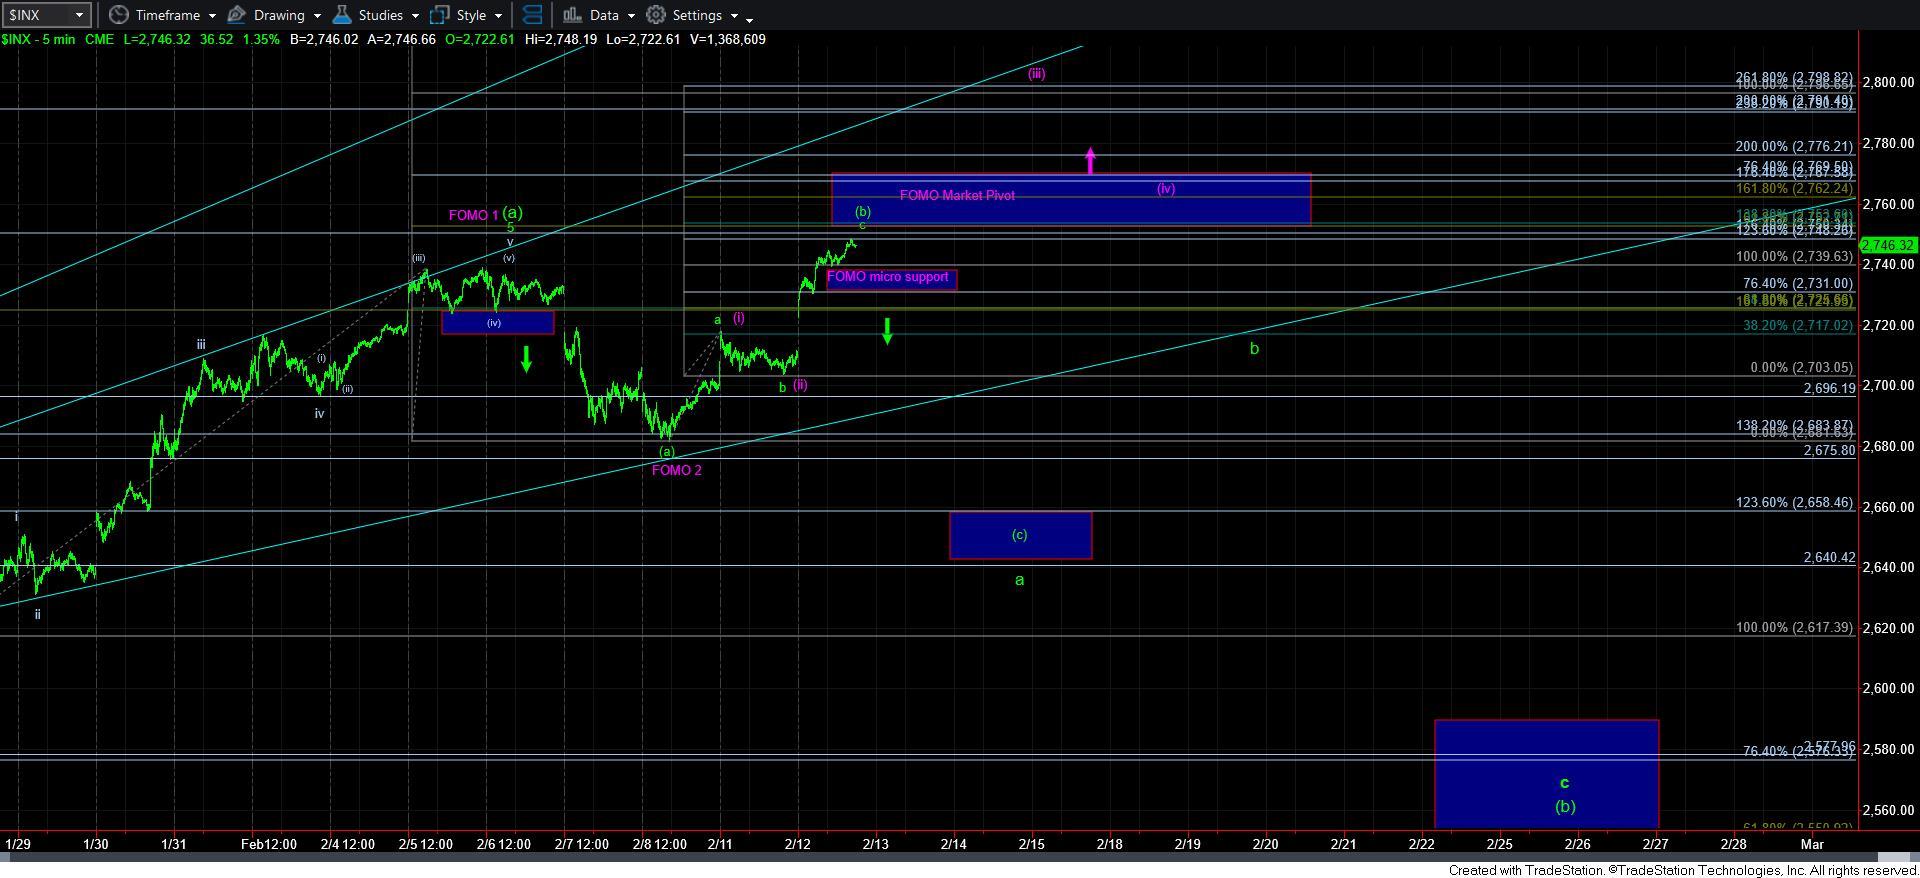
Based upon standards we normally follow, the (a) wave should not have taken us past the 2685SPX region, which was where the top of my (a) wave box resided. While the market did turn down within the box, and consolidated for 10 days, it did not even pullback to the .236 retracement of the rally into the 2675SPX high we struck before that consolidation.
To view a consolidation that does not even reach the .236 retracement after a 350 point rally and which only takes 10 days is something that is rarely seen for a (b) wave of this magnitude. In fact, I cannot remember ever seeing one so relatively small. Yet, this is something which the FOMO (Fear Of Missing Out) count I presented last week suggests I may have to take much more seriously.
Moreover, as I noted last week, if the market only pulls back to the 2685/90 region, it would provide perfect confluence to just over the 2900 region for that FOMO count [c] wave target. That would provide us with a 2.00 extension of waves 1 and 2 in the FOMO count which would meet the point at which [a]=[c] in that FOMO count. And, our last pullback held a low of 2682SPX.
So, as I posted earlier today, the market would now have to break back down below 2724SPX to suggest that this count is not going to carry us higher sooner rather than later. That suggests 2724SPX is now our main support.
Overhead, I have added a pivot region for this FOMO count. Remember, the region between the .618 and .764 extension of waves 1 and 2 present us with a strong indication as to whether the market will maintain an impulsive structure, or if the rally is simply constructive in nature. So, assuming we do not see a break down this week below 2724SPX, and the market rallies through 2770SPX, then 2750SPX becomes support, and we are likely on our way to target the 2910-40SPX region in the [c] wave of the b-wave.
Again, the extent of this direct rally was clearly not my primary expectation as we do not normally see a b-wave go straight to the target in such a direct fashion. And, since we have to deal in probabilities rather than possibilities, I could not consider this my primary count unless it provided much stronger clues to its potential. And, should any pullbacks now hold over 2724SPX, and then continue to rally in impulsive fashion, or if we take out 2770SPX without breaking back below 2750SPX, then I will have no choice but to assume the lesser likely path has taken hold for this b-wave, and we are moving directly to the 2910-2940SPX region for this b-wave.
So, in summary, upper micro support is in the 2730-40SPX region for the FOMO count. If we pullback correctively and hold that support, then we are next pointing up towards the 2760-70 region. However, if the market can break below 2730 and follow through below 2724, then we are back on track in the green count. But, clearly today’s action forces me to take the FOMO count much more seriously.