The Fourth Wave Gets Sloppy
 By
By
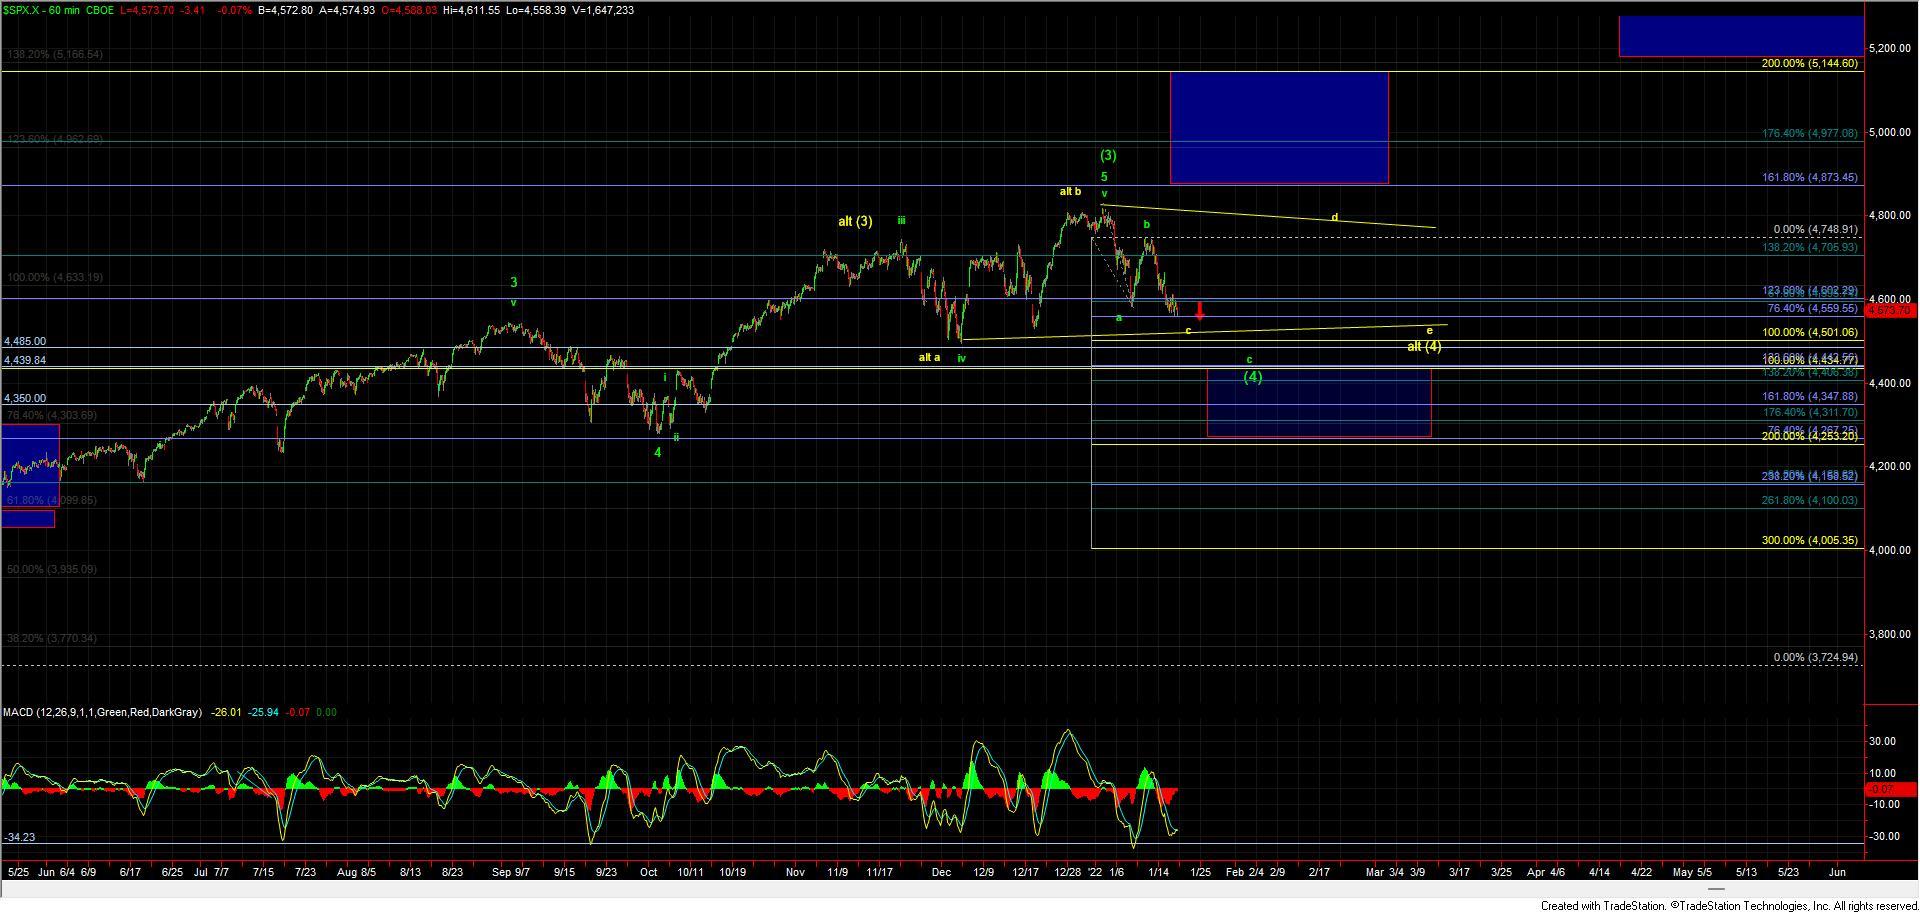
Yesterday we saw the markets push and break support thus giving us initial confirmation that we had indeed already begun the wave (4) down. That break had us re-order the counts with the new green count having us in a wave c of (4) down with the larger degree support coming in at the 4434-4253 zone as shown on the 60min SPX chart. At the close yesterday, that wave c of (4) down still was showing the potential to follow-through in a more direct impulsive wave pattern which would have pushed this fairly deep into that support zone. I also laid out the potential for this to become more complex and morph into an ending diagonal pattern to complete that wave c of (4) down. The inability to see a direct breakdown today but rather a hold of the 100ext of the initial move down off of the 4748 high is suggesting that the market is indeed following that Ending Diagonal pattern and that we are likely going to see a more complex push down into the support zone. Furthermore, we have yet to break below the 4500 level, which is acting as support for the yellow triangle count, so with that, we still have to keep this yellow path on the charts as a valid alternate count for the time being. Should we break that 4500 level then we can remove that yellow path and focus on this to finish off the green wave c of (4) into the support zone noted above but for now it remains on the chart.
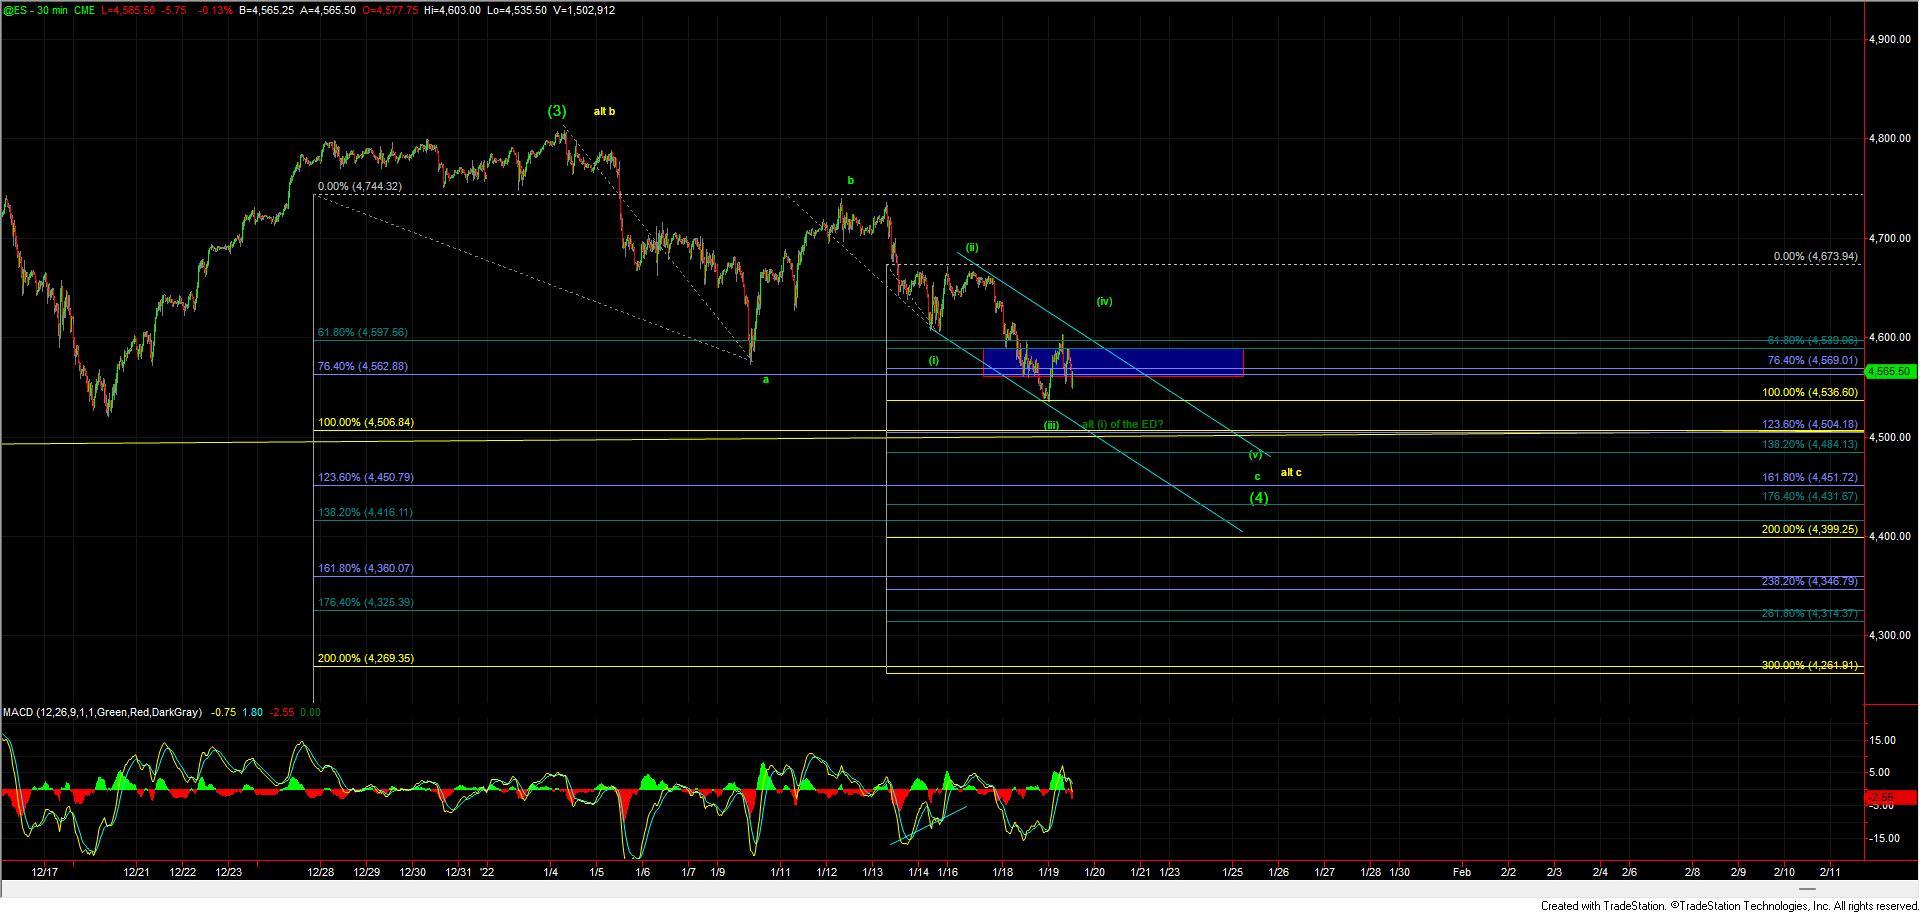
Now, while I do not want to get too overly focused on the smaller degree timeframe charts as they are going to be very difficult to track as we move through this corrective wave action, I do want to at least layout the general path that this should take if we are indeed going to follow the Ending Diagonal pattern to the downside. Under that case and as shown on the ES chart, we still would need at least one more lower to finish off the wave (v) of c of (4) down towards the 4500-4450 region. This should then be followed by a fairly sharp reversal back higher to start the wave (5) up to new highs. For now, however, this does still look like we have a bit more work to do to finish off the pattern to the downside and we need to remain nimble as this continues to grind its way lower completing the pattern into the support zone below.
The key takeaway from today's price action should really be continued focus on the bigger picture pattern. Fourth waves are notoriously choppy and can grind away one's patients and profits if not careful. For now, the market does seem to have a bit more work to do to the downside before the wave (4) is completed. In the meantime, we will continue to track the action as we continue to grind lower and layout the parameters to watch for a potential bottom as they develop.