The Fat Lady Is Still Warming Up
What a wild day. But, I cannot say it was completely unexpected.
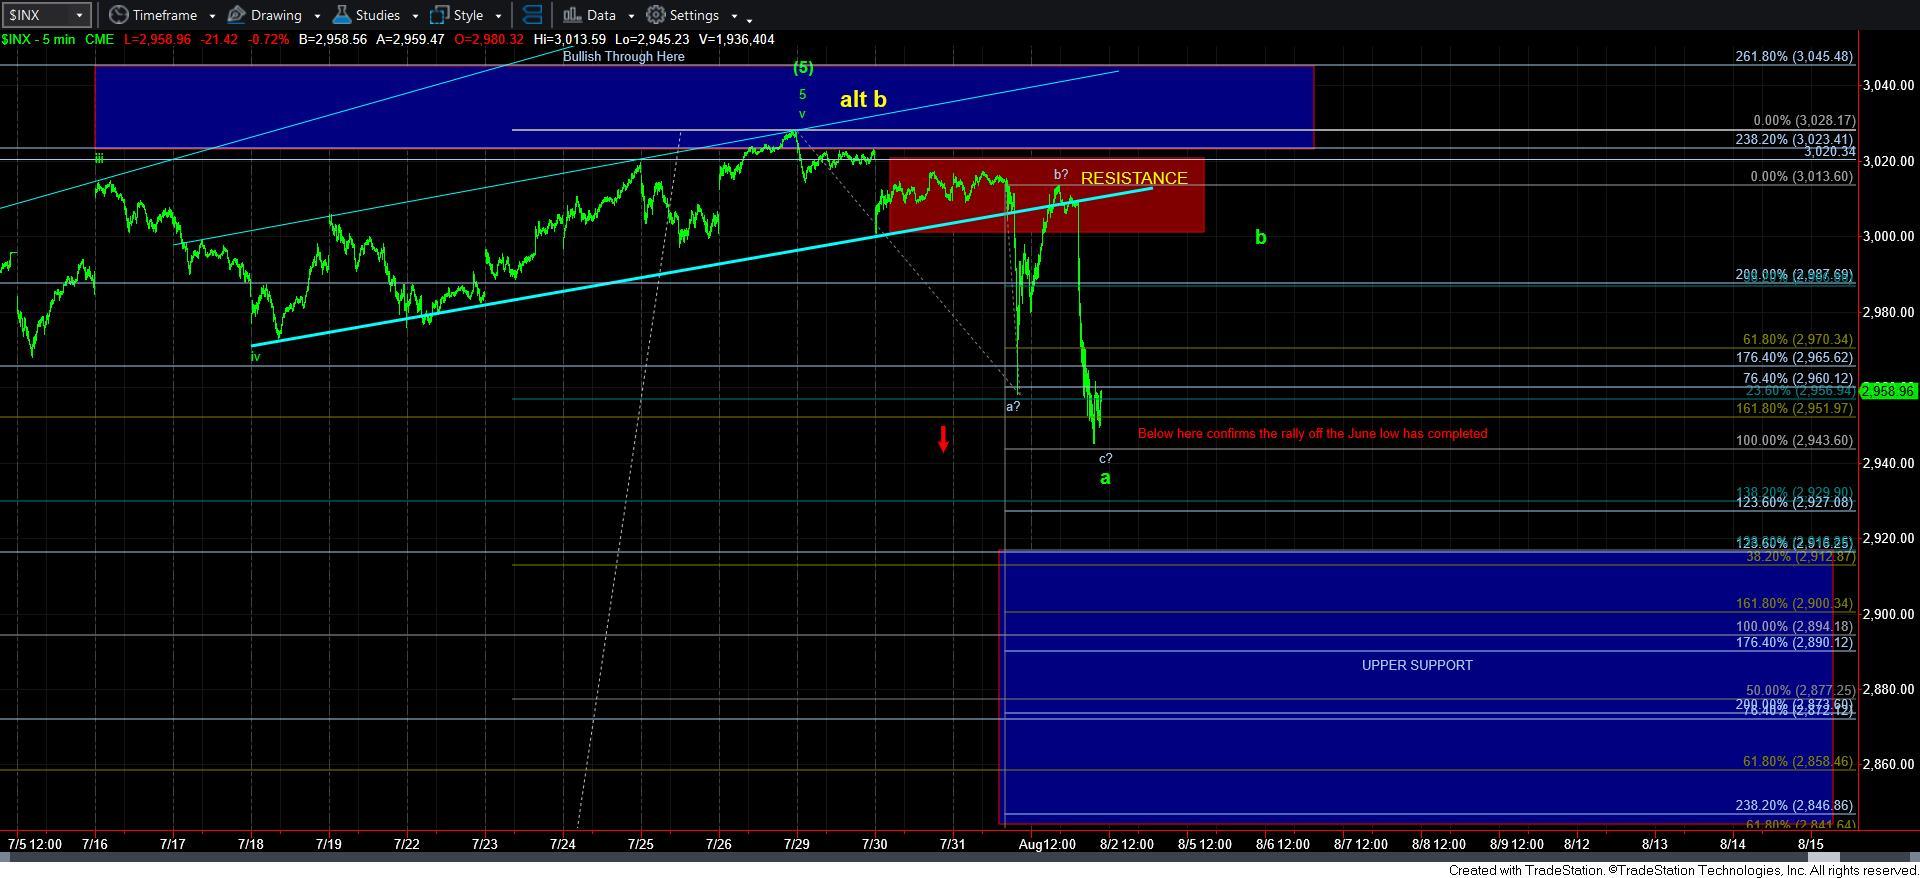
As the market rallied strongly right to the top of our resistance region today, I note the following in an alert:
“For anyone who remembers trading during the 2008-09 financial crisis, one of the things you may remember is that corrective rallies were ridiculously strong. For now, I have to view this as a corrective rally. In the cash SPX index, the a=c off the lows comes in around the 3020SPX region.”
The market then topped in the 3013SPX region, and began to decline quite strongly. As the decline took shape, I further noted that we need to watch the 2940SPX region for a potential bounce– with the chart showing the a=c off the all-time high in the 2943SPX region. As I write this update, the low so far today was 2945SPX.
Thus far, I cannot say that the market has confirmed the top is in place. But, I can say that the fat lady is certainly warming up and the curtain is about to rise. But, before that curtain does rise, should today’s low hold as support, we may see another corrective bounce before she begins to sing.
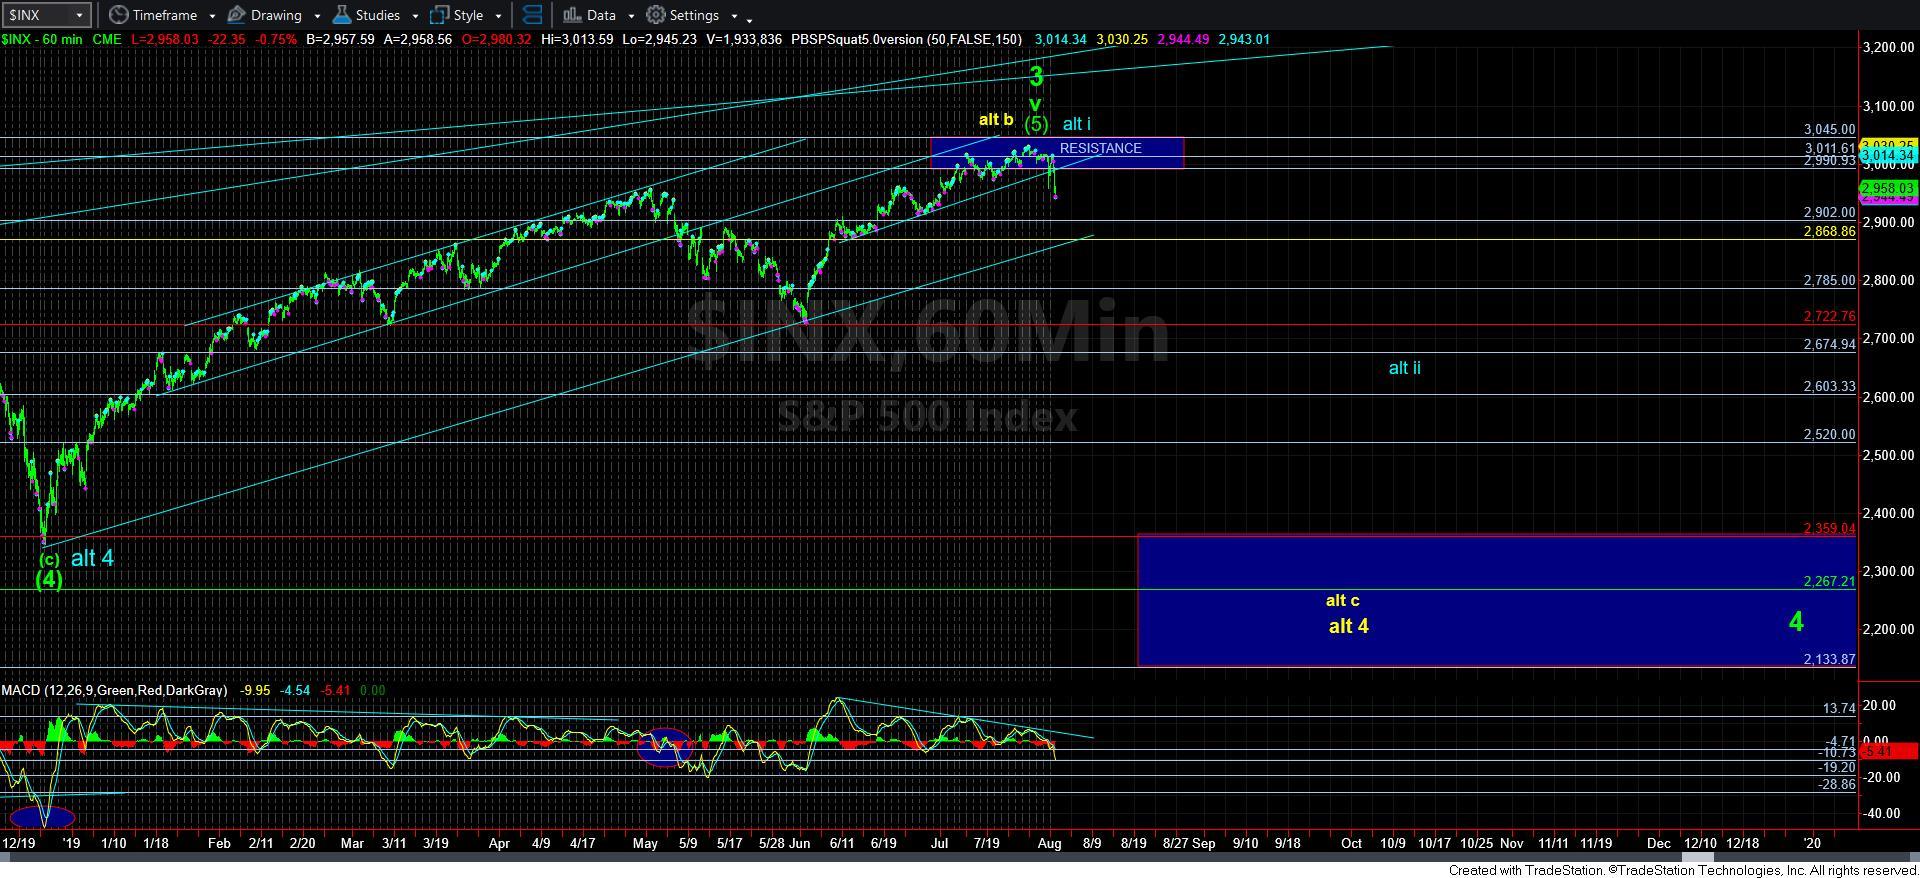
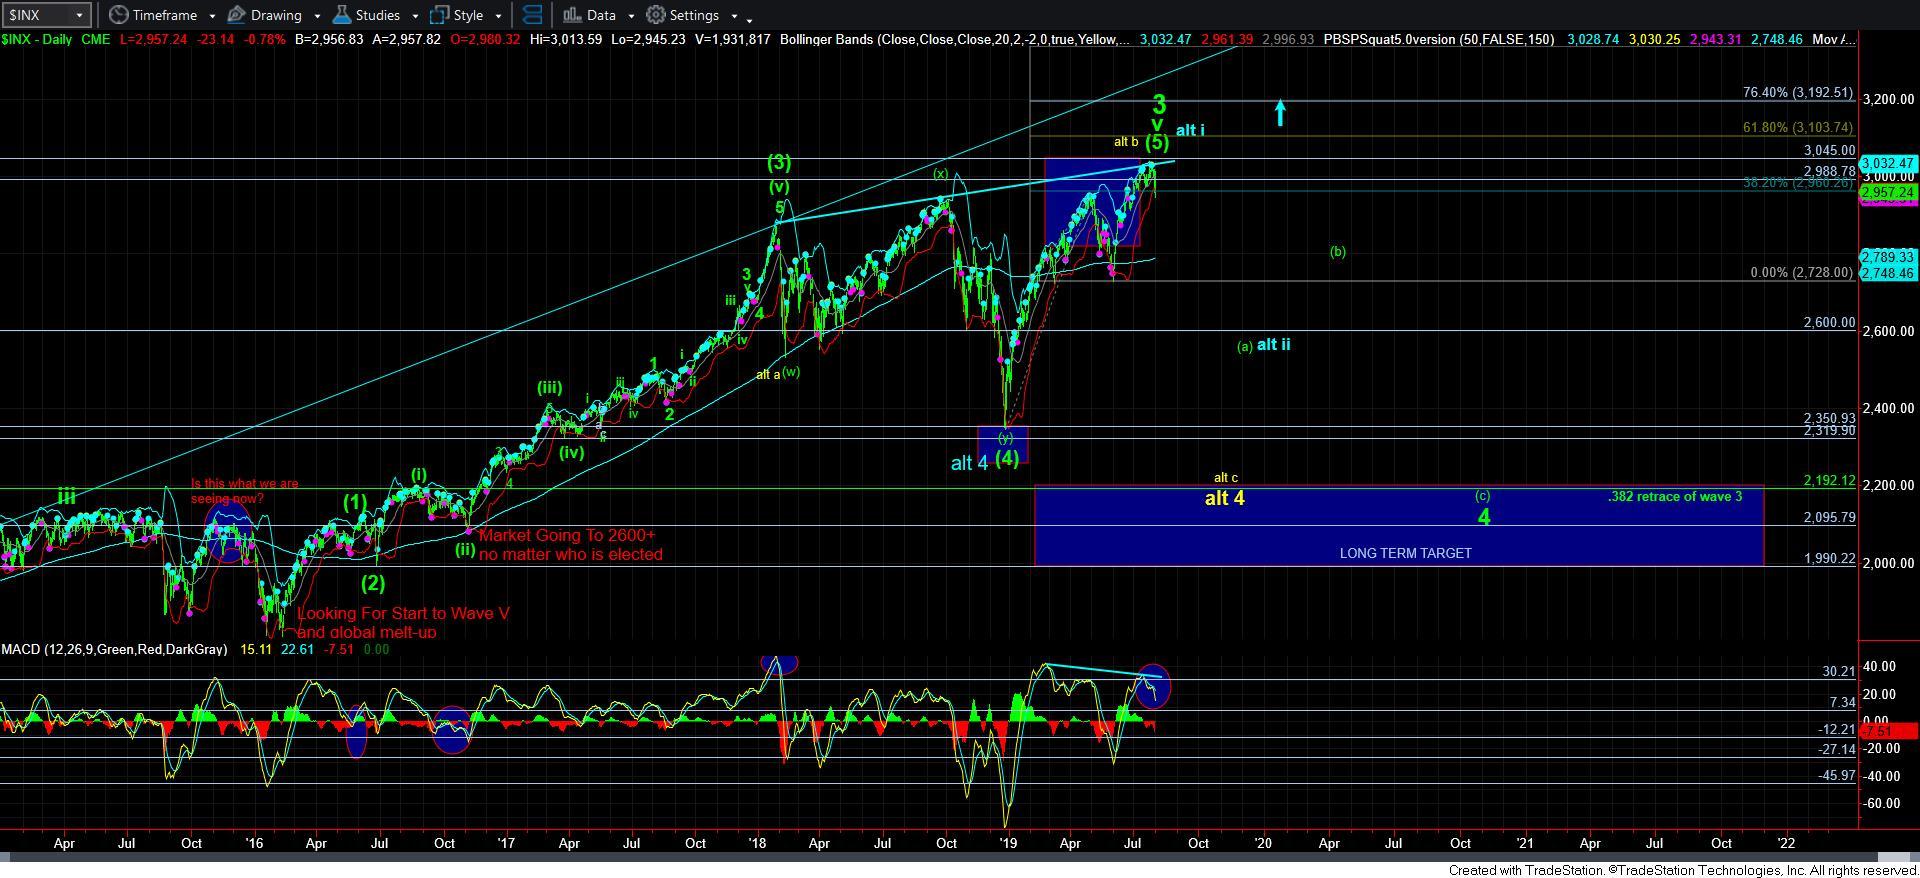
Based upon the current decline to date, I cannot say I have any confidence in the yellow count at this time. You see, I would have needed to see a CLEAR 5-wave structure to strongly consider that yellow count. So far, I cannot say that I have any clear 5 wave count to the downside developing – at least not one which adheres to standard Fibonacci Pinball structure. But, I will wait to see how we drop into the 2900 region before I make a final assessment. As it stands right now, I would place that potential at the back of the line.
The more likely scenario right now seems to be that wave 3 off the 2009 lows has topped, and we have potentially begun a long term 4th wave correction. Of course, I am going to be tracking the potential for the more bullish blue alternative as we move through this pullback, as I personally do not want to miss the potential for an 800+ point rally because I was stubbornly only looking down.
But, once the market does see a strong break down below the 2950SPX region, any move back up through the all time high thereafter will be a strong signal that we are rallying in the heart of a 3rd wave higher, and I will likely have to adopt the blue count. But, for now, that is not going to be my primary perspective.
We may still have to wait a bit longer before the market finally sees a sustained break down below 2950, because if we continue to hold today’s low, we can easily see another bounce before that begins – as outlined on the 5-minute chart in the green b-wave.
But, the bigger perspective I am focusing upon at this time – which I have noted several times over the last 24 hours – is that the daily SPX chart MACD does not look terribly healthy. Rather, it suggests that we have just begun a decline after seeing several higher price highs on negative diverging technicals in the MACD. So, for now, I am going to be looking lower, especially once the market finally provides us a sustained break of the 2950SPX region.