The Ending Diagonal Is Dead
While I was tempted to start this paragraph by saying “long live the ending diagonal,” I have chosen to abstain. (smile) Also, I am putting out this update a bit earlier than normal because I have to leave a bit earlier today.
With the break over 2717.50, the ending diagonal pattern has invalidated, which still leaves us with two patterns – the triangle, and the more bullish yellow count. And, today, I noted what it takes to resolve between the two of them:
I am going to attempt to synthesize a smaller degree chart to outline how to follow the differences between the purple and yellow counts at this time.
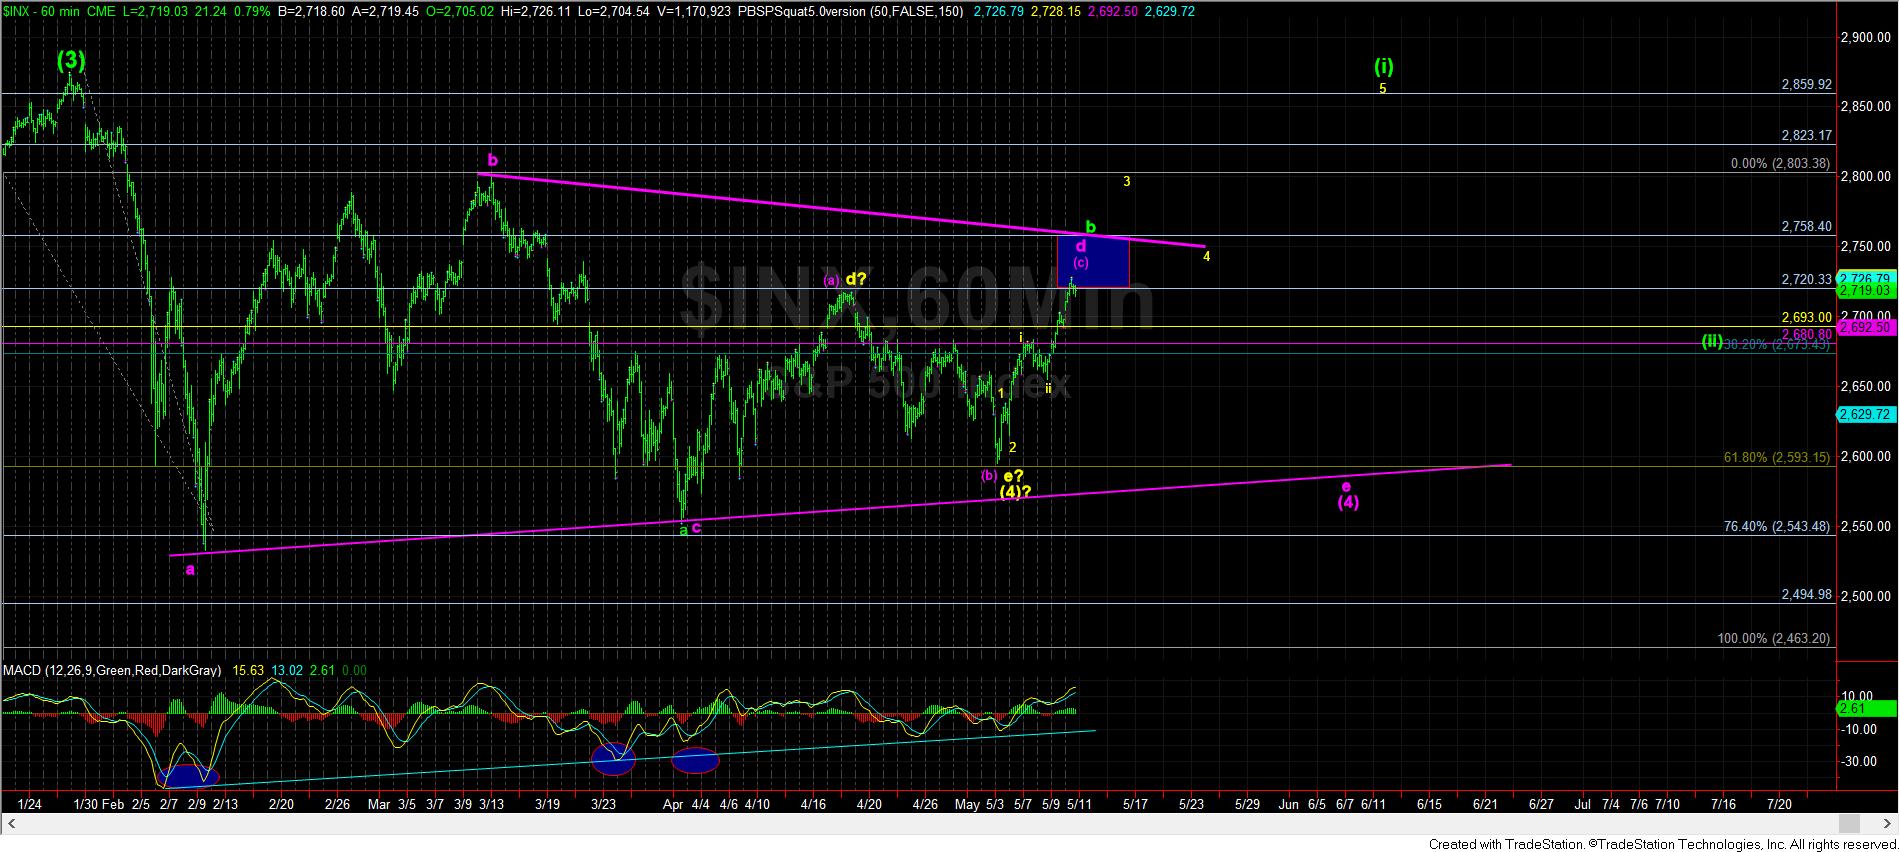
First, in the purple count, if we should top at 2722SPX, that is about as much as I can accept for this to be ALL of the (c) wave in the purple count for the d-wave of the triangle. Moreover, as presented in the lighter purple count, we would need to break below 2680 (the .382 retracement of the alternative purple 3 high in this region) in order to suggest we are in the a-wave of the triangle count.
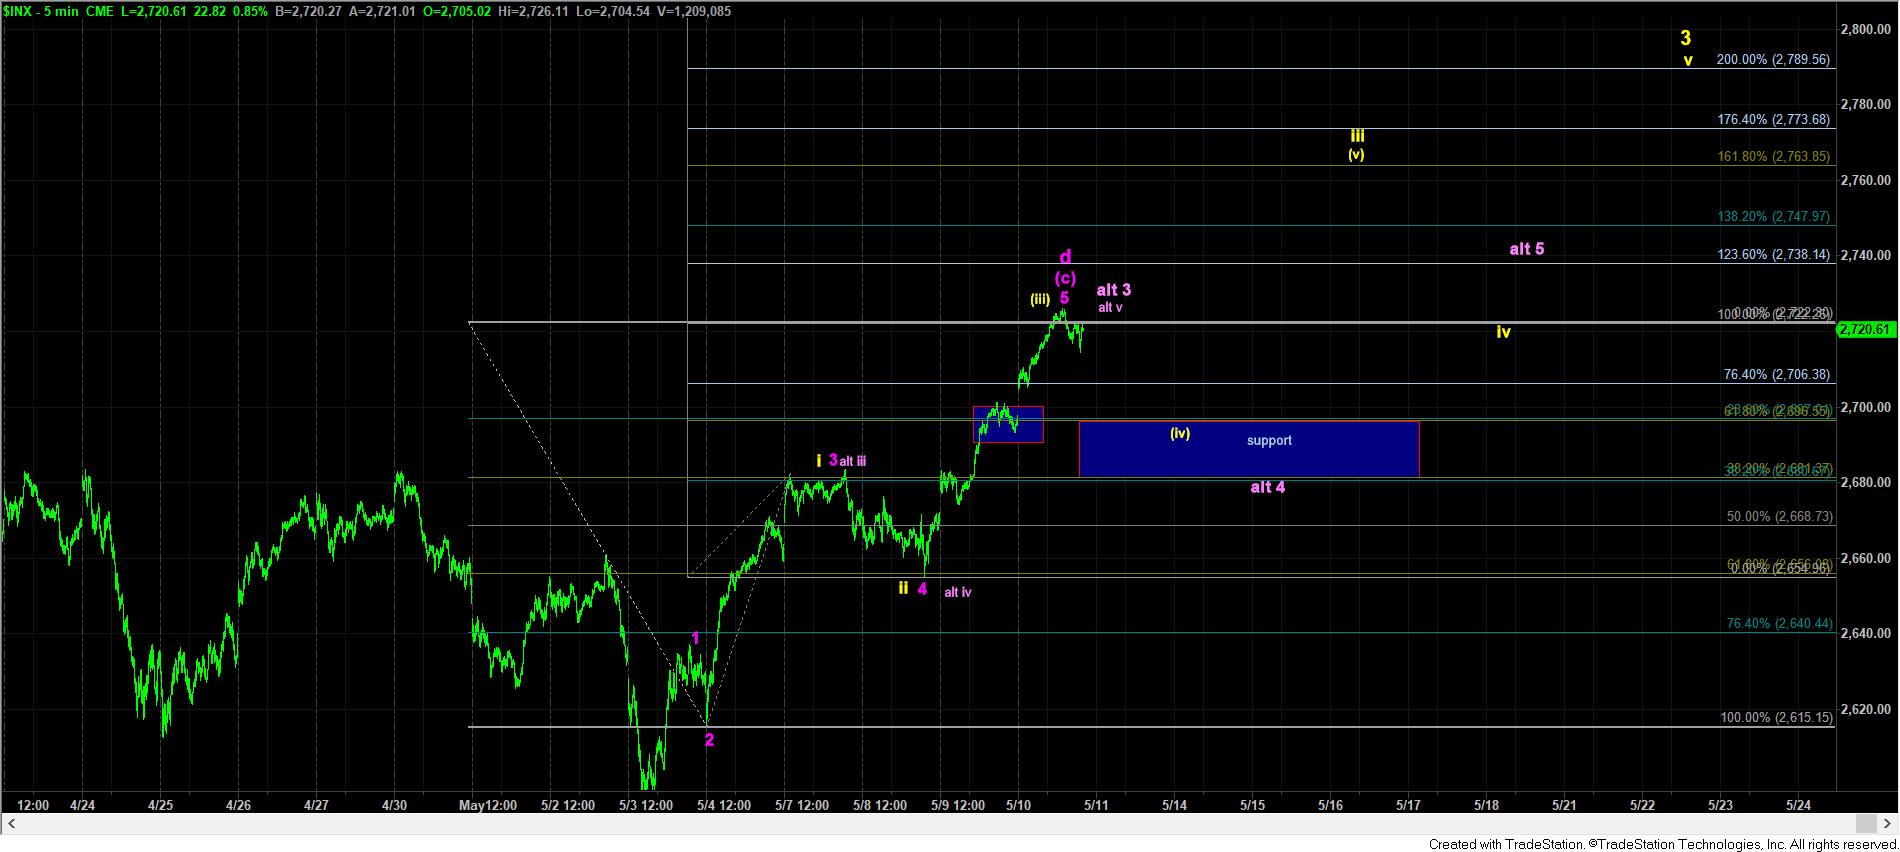
In the yellow count, support, as noted before, is the 2693/96SPX region. In the more aggressive yellow count the market is now striking the 1.00 extension of waves i and ii, which means the .618 extension should hold as support on a wave iv pullback. Should the market blow past 2722SPX, and head up directly to the 1.236 extension at 2738SPX, then it makes it much more likely that we are in the yellow count, and the .764 extension at 2706SPX then becomes primary support for continuation higher in yellow.
So, the main point is that the more aggressive bullish count has 2693/96SPX as its support, whereas the 2680SPX level must be breached to suggest we are in the e-wave of the triangle.
As we saw the rest of the afternoon, the market slightly exceeded 2722, but did not blow past it – at least so far. So, at this point in time, I think much will now center around the 2693/96SPX support region. Should we break that support at any point from now on, it will likely suggest that the triangle pattern is in play, and we are going to see an e-wave in the triangle over the coming weeks. While holding the 2680SPX level can still give us one more rally into the purple box, all I need to see is a break below 2693SPX to be much more confident of the triangle continuing to play out.
While I have still retained a b-wave count high for this move on the 60-minute chart, the ONLY way I will adopt that potential which will point us again to lower lows in the 2450-2495SPX region is if we see a CLEAR 5 wave structure coming down out of this target box, which would suggest the commencement of a c-wave to those lower levels. But, as it stands right now, we have no such set up, so I view this potential now as the lowest potential on the probability scale.
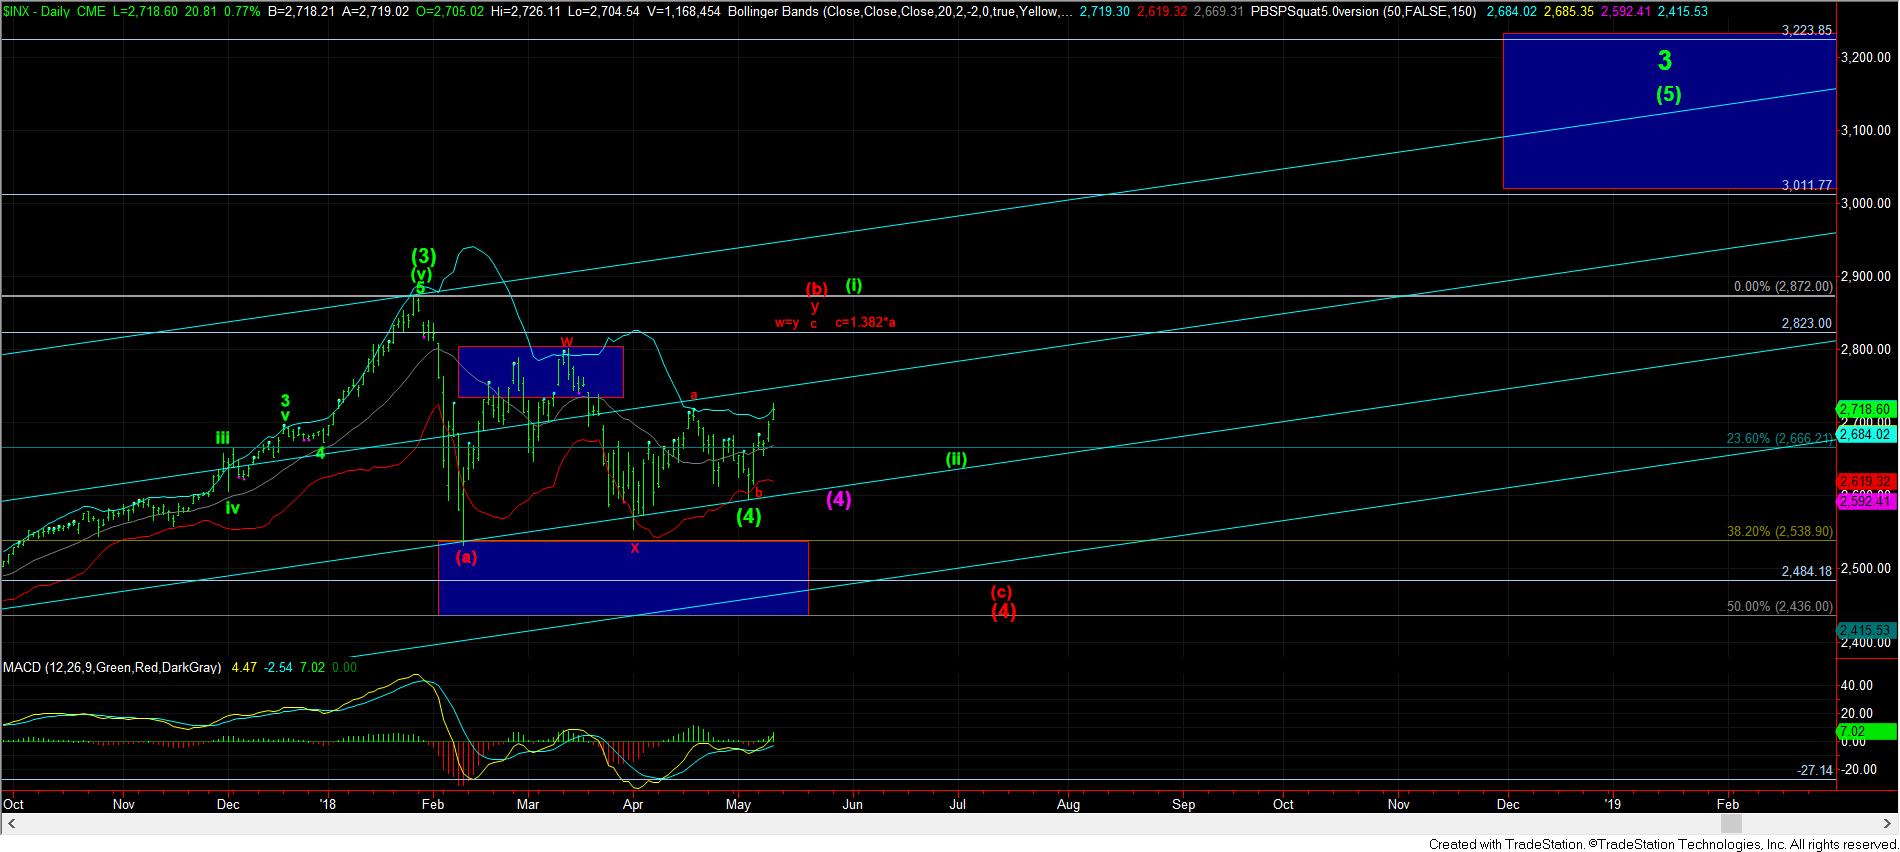
Ultimately, as long as we hold over the 2693SPX region, the bulls have opened the door to run this back up over 2800 sooner rather than later. But, as I also posted in our chat room today, if the market tops out at exactly 2823SPX in the coming weeks, without breaking below 2693SPX first, it leaves me with yet another bearish possibility – as shown on the daily chart in red, where the yellow count on the 60-minute chart is actually presented in green on the daily.
You see the 2823 level is where w=y within this structure, and the c=1.382*a. A market topping at that level in the coming weeks would put me on high alert for the potential of a bigger c-wave lower, as presented in red, but we would again need a CLEAR 5 wave structure to the downside to view this as a higher probability. Until such time, this is just something I maintain in the back of my mind for now.
In summary, today’s action has eliminated any immediate structure pointing to lower lows in the SPX, as any downside should now be contained within the triangle. Should we see a CLEAR 5 wave structure break 2693SPX, then I will alert you to the potential to see lower lows again. But, until such time, I am not expecting us to break below the lows we struck in the c-wave of the triangle.