The End Of The Line
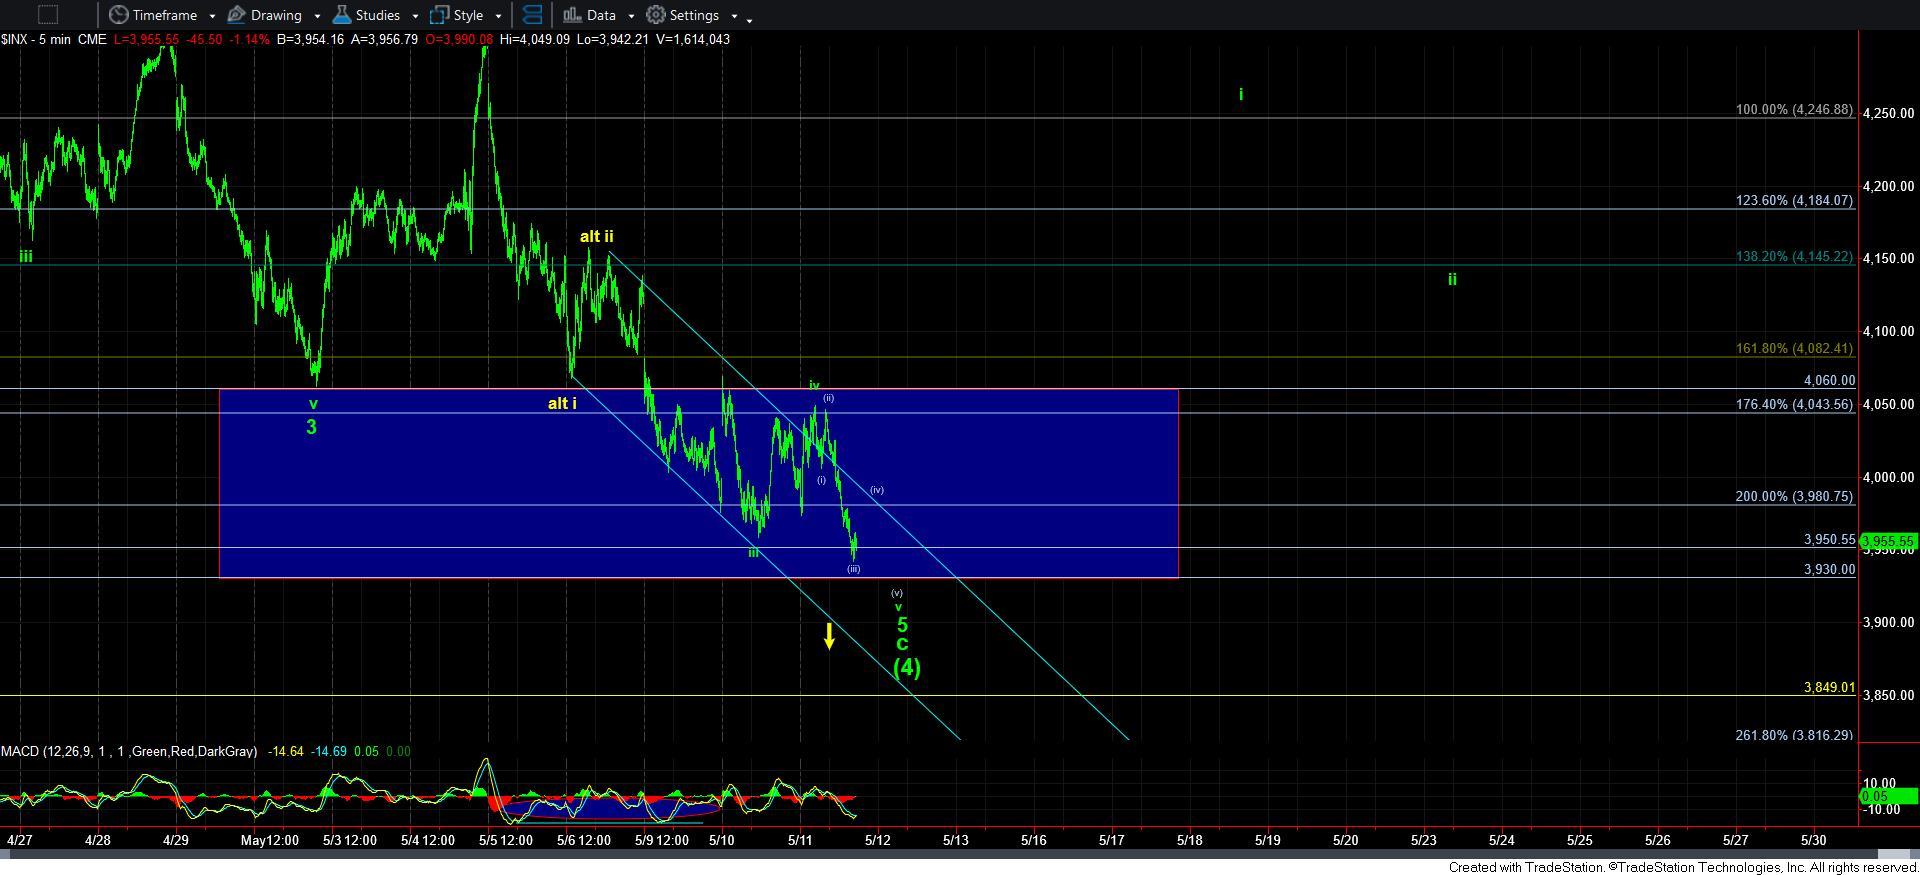
This decline SHOULD now be the final spike down, as I have basically run out of room on the wave [4] wave count.
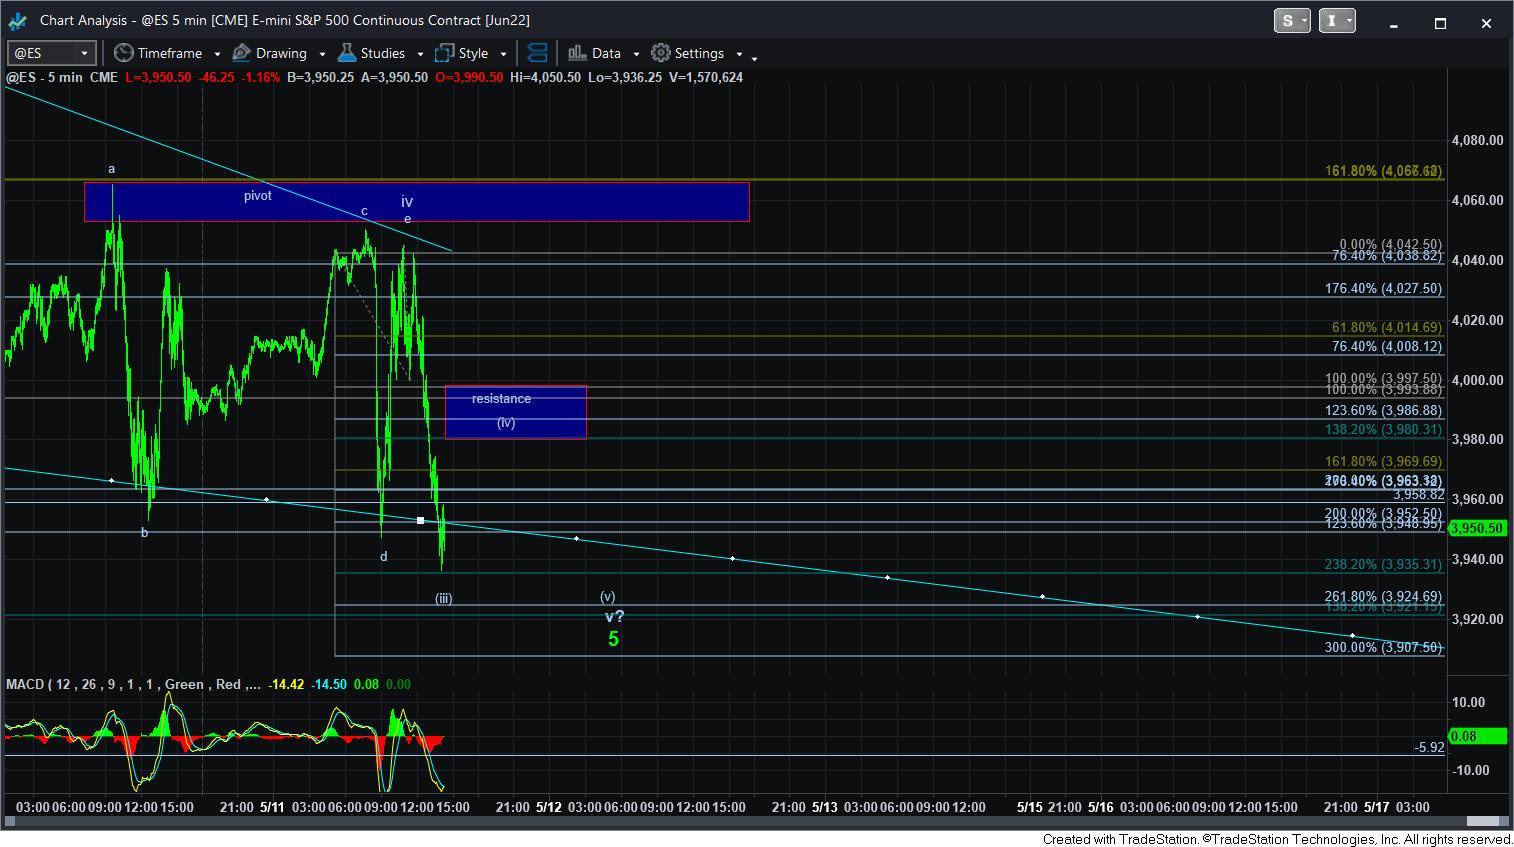
As you can see on the attached 5-minute ES chart, as I am writing this, we are in a wave [iii] decline off today’s high. And, this should be the final 5 wave decline to complete this last segment of the c-wave of wave [4] if the count is correct.
That means that we are still looking for a wave [iv] bounce followed by a final 5th wave lower low to finally complete what has felt like a never-ending correction.
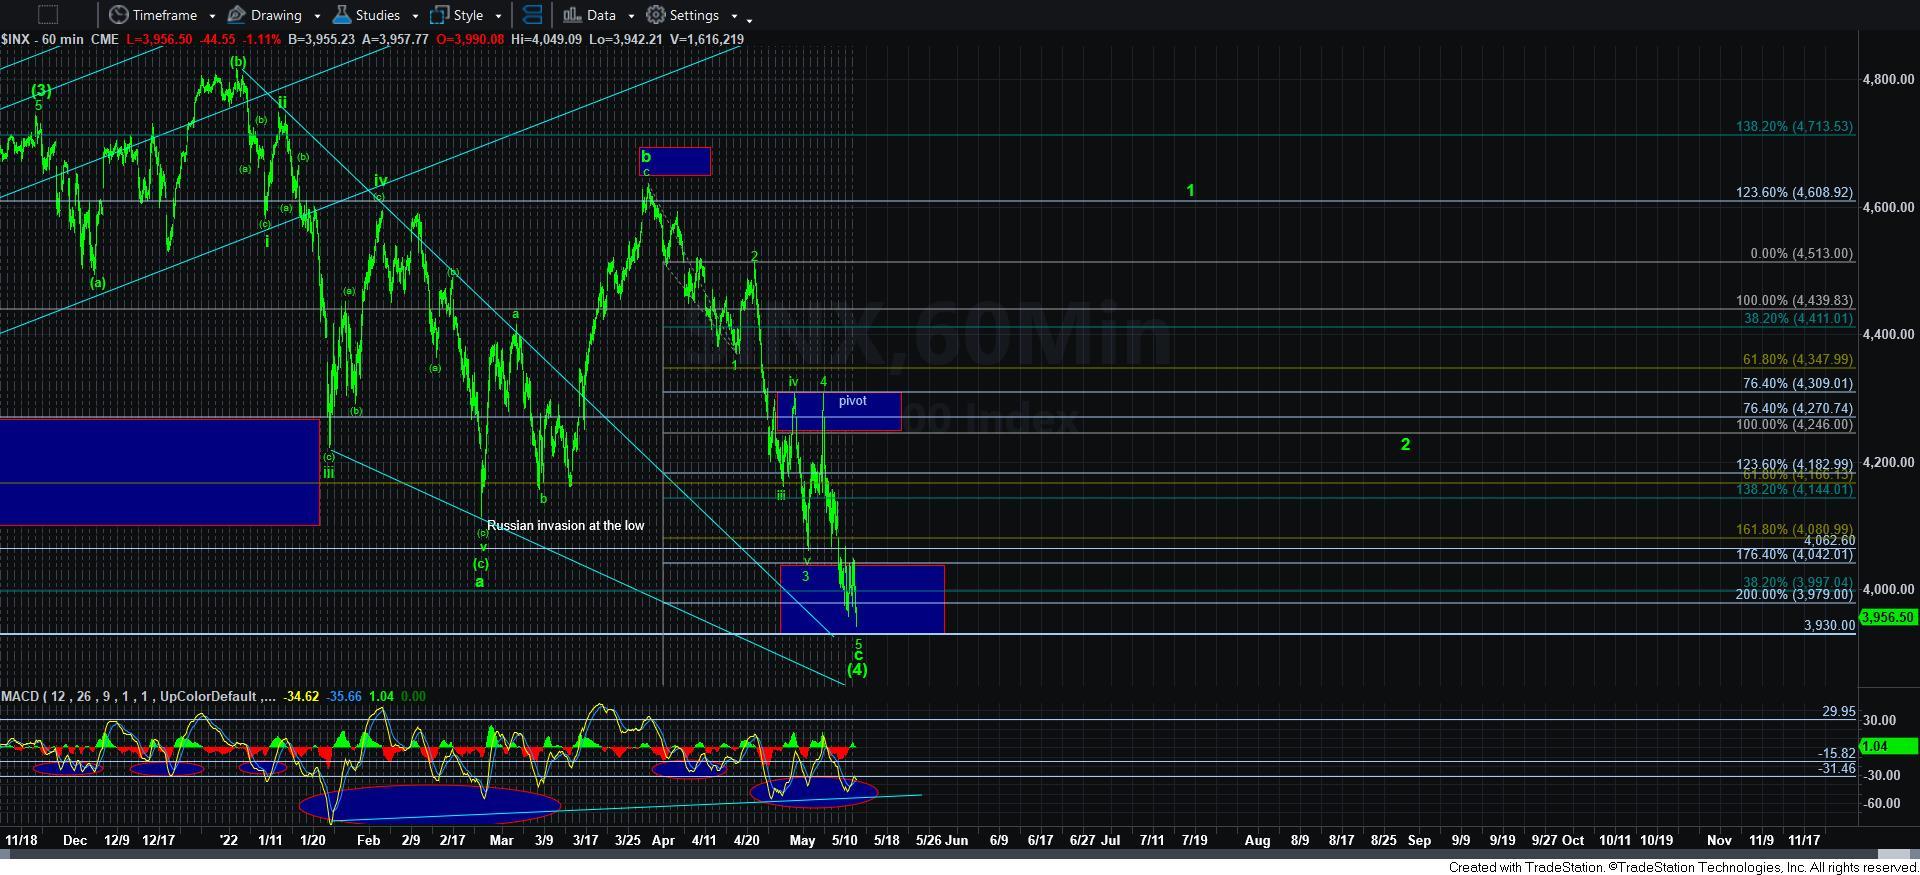
What gives me a bit more confidence in this potential is that the MACD on the 60-minute chart is set up in an almost perfect bottoming structure. The divergences we have been seeing since the bottom of the 3rd wave in the [c] wave of the larger a-wave is most often a strong indication that we SHOULD be FINALLY completing this structure. And, the divergences have now become quite stark.
But, again, I want to see waves [iv] [v] in the final 5th wave take shape on the 5-minute ES chart to confirm that bottoming structure, as this wave [iii] has become quite extended and it may still extend a bit more.
Now, in the bigger perspective, whether this is wave [4] in green or wave [iv] in yellow, I do not think it will really matter to me at all. Should the market begin a rally to higher highs, I will be treating this next rally as the final rally and selling out most of my positions, as I had been planning the entire time. So, whether we called this wave [iv] in yellow or wave [4] in green, it really is only academic for now, because I am personally selling out almost all my positions after the next major rally completes.
For now, I am looking for the completion of waves [iii] [iv] and [v] on the 5-minute ES chart, and then I think we can finally be ready for a real reversal, which I still want to see as an impulsive structure breaking back out over the 4070SPX region to confirm that a bottom has indeed been struck.


