The Direct Path Before Us
With the market continuing to push higher, it has clearly told us that it was going to target the lower blue box target before giving us a 1-2 set up for 2900+. So, last night, and again this morning, I explained how this action lays out our options before us in a step-by-step manner:
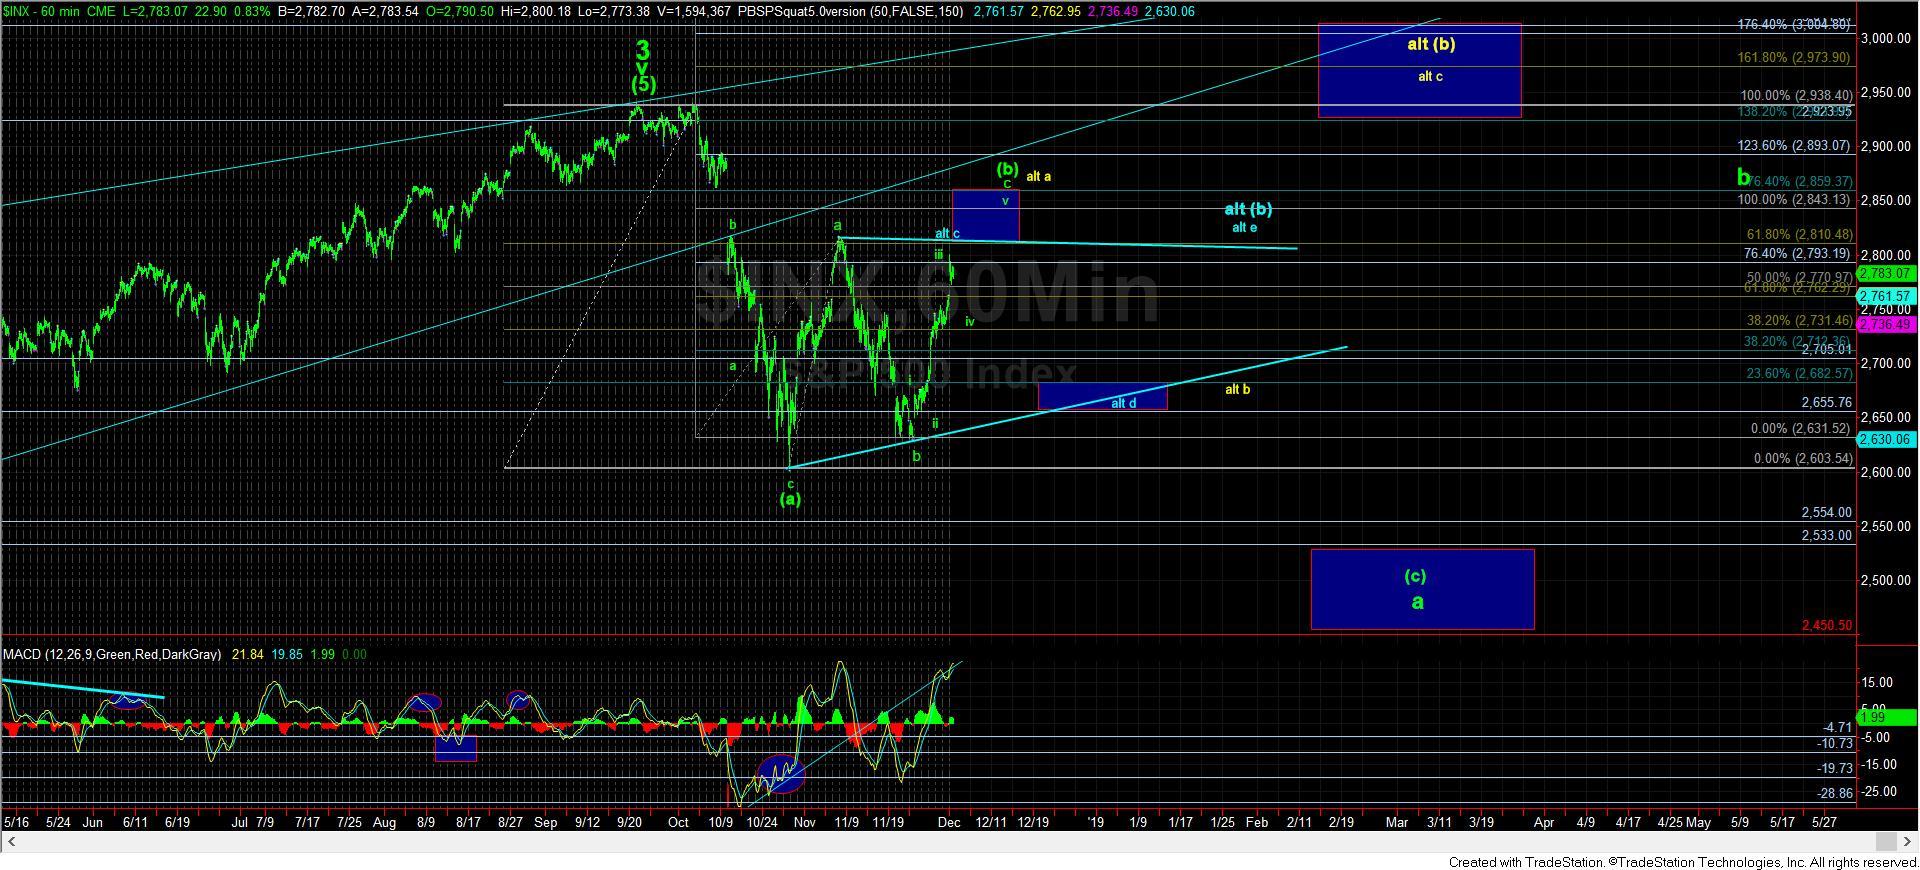
I am going to re-post what I posted last night. But, first, I want to highlight that resistance is now between 2820-2860SPX. Support is now at 2750SPX. And, the question now is from where we break that support.
First, with this continued strength, we will not have the 1-2 set up I wanted to see pointing to 2900+ right now.
Second, this suggests that we are going directly to the lower blue box overhead on the 60 minute chart
Third, if the market tops at 2810/15, and then drops down from there, that would suggest the triangle is in play, and we will be mired in this region for the next several months. Moreover, there is at least one wave within a triangle that is a VERY complex structure. And, that would likely be the d-wave since it is normally the c-wave, and this c-wave would be quite straight forward. This means that the d-wave could take us at least a month on its own.
Fourth, if the market can push through 2820, and head up to 2840-60 region, then that can top out all of the (b) wave, and point us down to the 2500-2530 region for the (c) wave of a. We would need to see a clear impulsive 5 wave drop off that resistance to make me aggressively bearish for a move down to 2500..
Firth, if we drop correctively off the 2845 region, then it opens the door to the more protracted (b) wave presented in yellow.
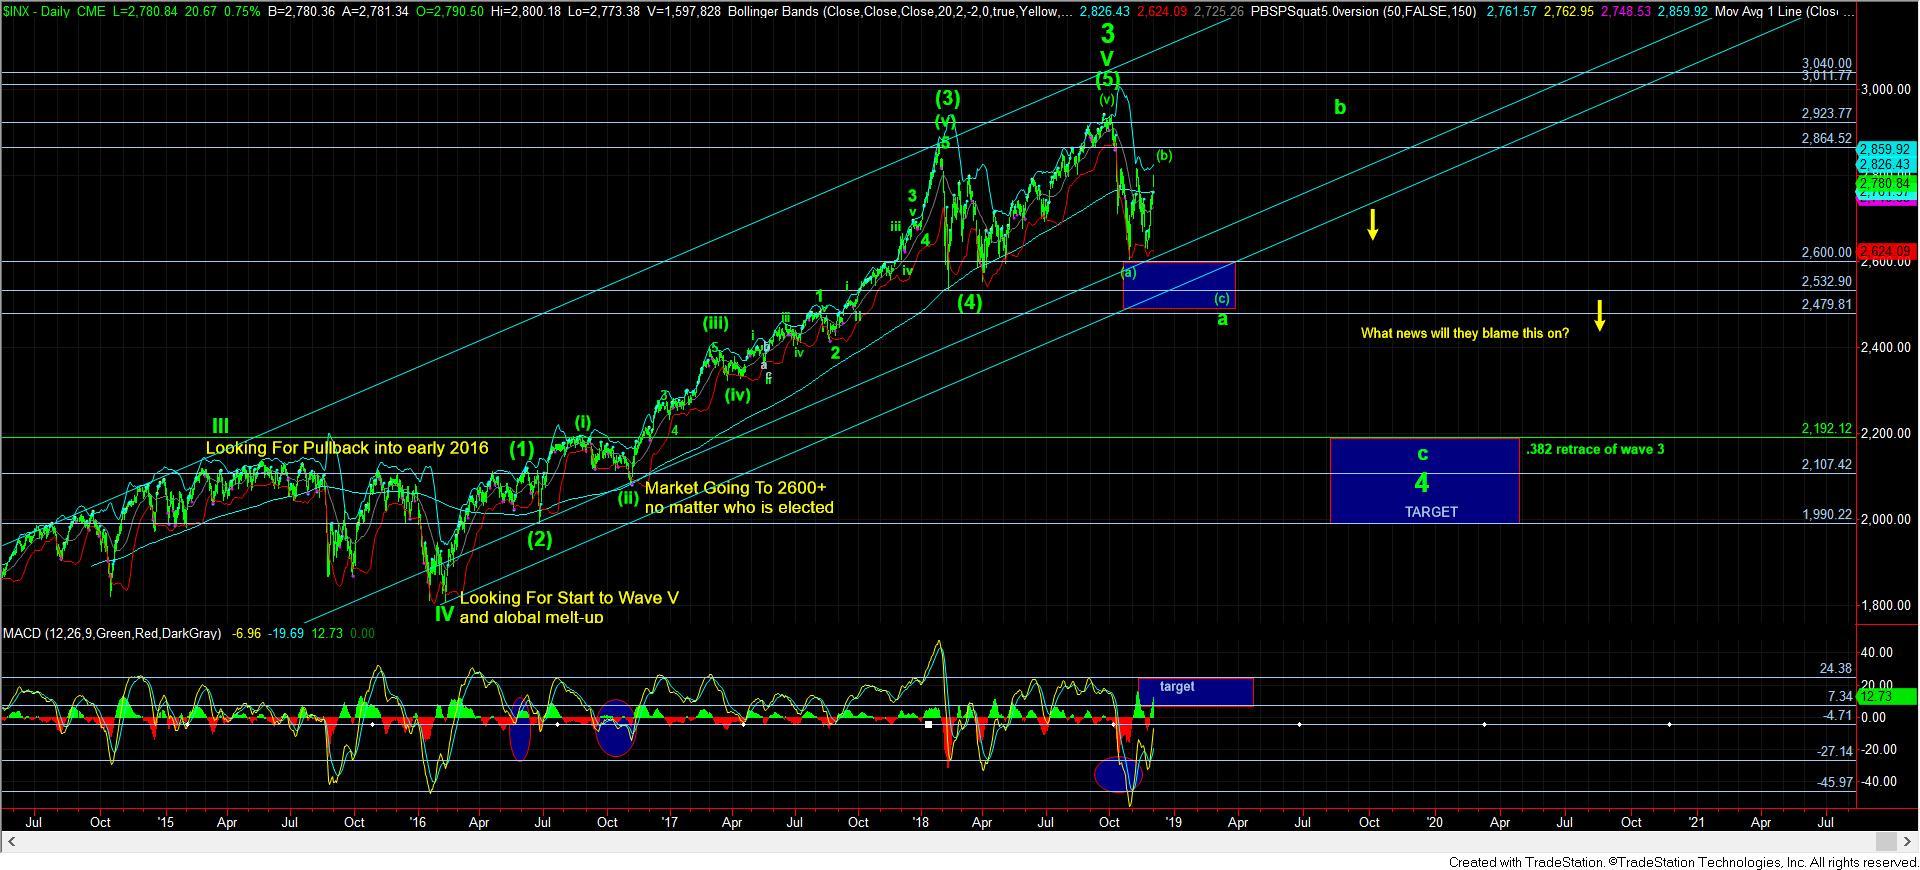
Lastly, I want to note that the 2860 region is the .764 retracement of the initial decline off the all-time high, and a gap fill level. Moreover, it would provide us with an a=c right into the top of our lower target box at 2530 region for the (c) of a wave of wave 4.
What we will need to see to turn bearish would be a 5 wave structure develop off a topping point, which then takes us below the 2750 support to point us to the 2500 region. Until that happens, I am going to remain somewhat patient, and allow this rally to push higher towards that 2860 region potential.
So, while the market can still push higher in the coming days, I still view the potential to the downside as being much greater than the potential to the upside..
As I noted before, the above analysis provides a step-by-step approach as to how I will view the market in the coming weeks. Once this (b) wave completes – either in direct form to 2840-60, or as a triangle, it will likely set up the next drop to the 2500 region. But, I would not be trading for it until a relatively low risk set up is in place for it – in other words, after striking the 2840-60 region, we see a solid 1-2 downside set up. But, in the bigger picture, I still think we have more room to the downside in this market than we do on the upside as we look towards 2019. But, the process of setting up that big c-wave down to 2100/2200 will likely take many more months to play out.