The Chart Seems To Be Filling In Nicely
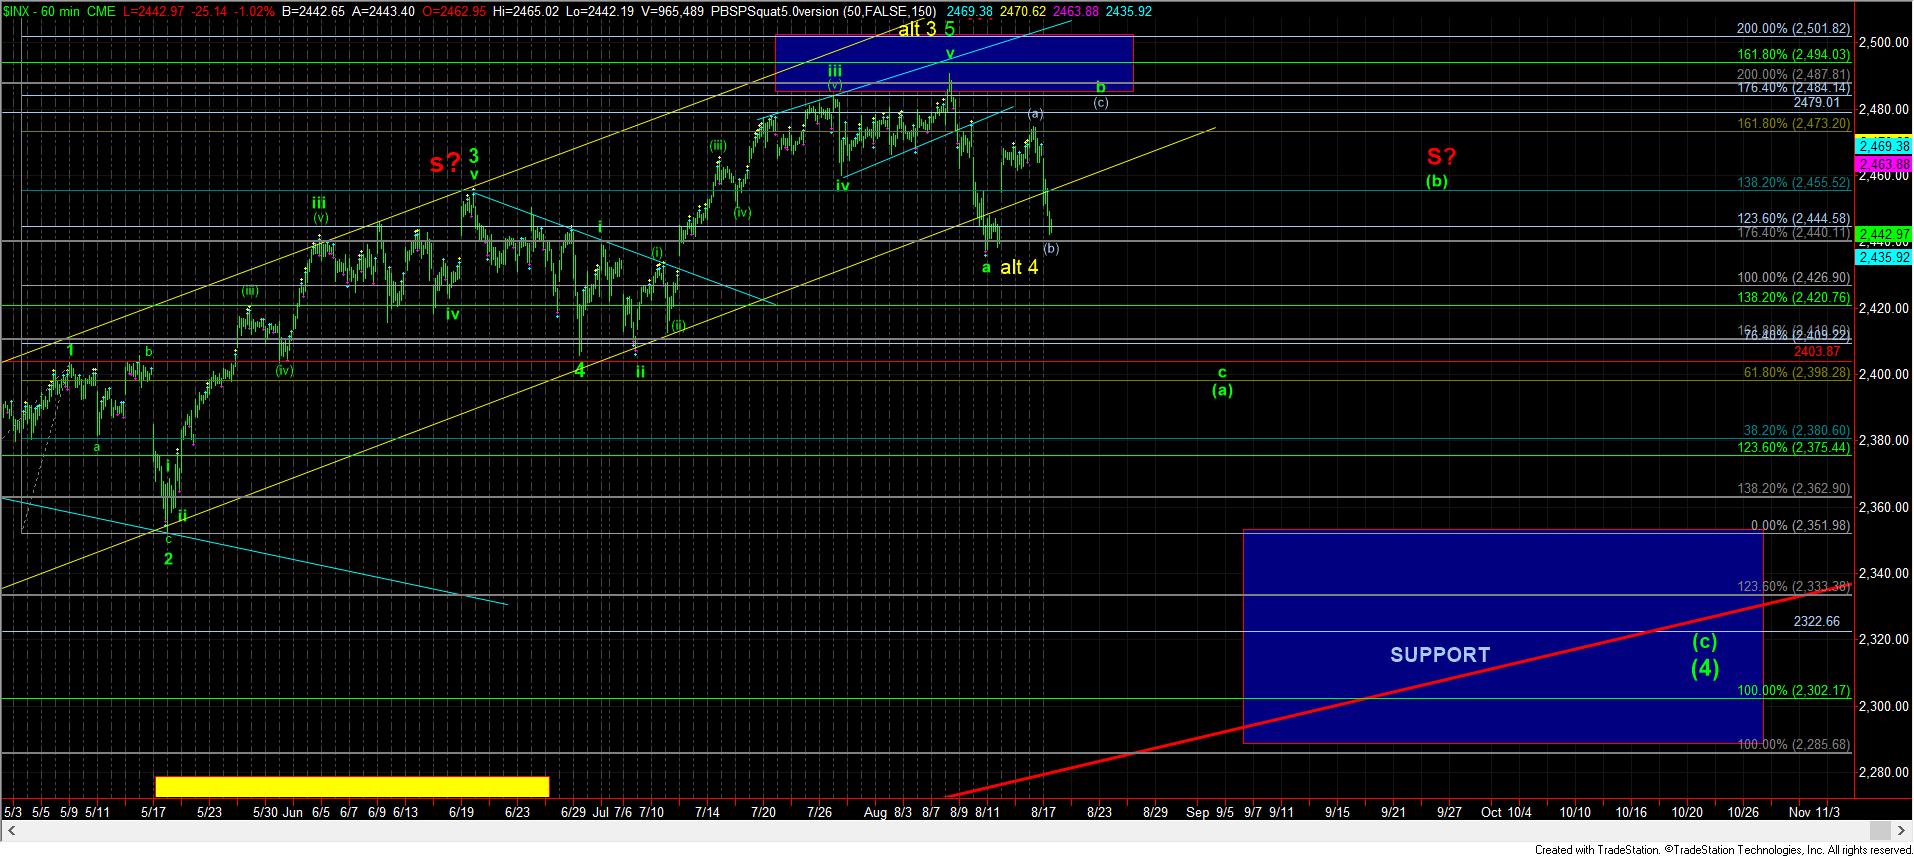
With today’s drop from what I have labeled as the (a) wave high, the market has been filling in the ideal pattern to begin the wave (4). While we clearly need a break below last week’s low to invalidate the potential in the yellow count, my primary perspective is going to remain the green count.
As I have said many times since we began this 4th wave, the nature of 4th waves is “whipsaw.” And, thus far, it has been certainly living up to its reputation. Understanding that you are likely within a 4th wave provides you with a certain amount of “power” over the market. For those that attempt to trade the market during this whipsaw action, the knowledge of being in a 4th wave should cause you to reduce your position size and widen your stops, since you know to expect whipsaw.
Now, if the market continued to provide us with a complex b-wave structure, it will rally tomorrow, and potentially into next week to complete the (c) wave of the b-wave of (a) of (4). Yes, I know that is a mouthful, so I always suggest you have the chart up to follow my narrative when I post analysis. But, please note that the market does not have to fill in that bigger b-wave pattern, and may choose to drop to complete the larger degree (a) wave from here. Remember, 4th waves are the most variable of Elliott’s 5 wave structure, so never assume something MUST happen in a 4th wave, other than the market providing us with a pullback/consolidation.
My resistance now is at 2477SPX, wherein (a) would equal (c), which is a common target for corrective patterns. And, as long as we do not exceed the 2491SPX level (wherein (c) equals 1.382 the size of the (a) wave), then the probabilities strongly suggest we are setting up to drop down to the 2380-2400 region to complete the larger degree (a) wave of wave (4), likely by the end of the month. Any break out through 2491SPX would begin to strongly suggest the alternative pattern is playing out, with the target in the 2520-2530SPX region as presented in yellow. But, as I noted yesterday, the yellow count is still the lower probability potential in the market in my humble opinion, and will be taken off the chart once we break below last week’s low.
Let’s take a step back for a minute, shall we. When the market was down at these levels last week, we about to head into a nuclear war. Does anyone see anything in the news which suggests that we are on the verge of nuclear war, and that is why we dropped down to these levels again? I didn’t think so.
Oh, but wait. Many are claiming today’s decline was because of the horrendous terrorist attack in Spain. But, may I remind you that markets have not sold off in a VERY long time due to terrorist attacks. Consider how many we have endured during this rally since the February 2016 lows? In fact, markets have rallied in the face of news about terrorist attacks, making many news followers scratch their heads in disbelief.
So, please remember that it is not the news that will direct the market. Rather, market sentiment directs the market. And, for now, it is playing out in a rather foreseeable manner. But, since I understand that the market is in a 4th wave, I also understand that there will be times during this 4th wave where it will diverge from standard patterns. The only thing that I can be relatively certain of, at least in a probabilistic sense, is that once we break the lows of last week, it is a strong signal that much lower levels will be seen in the coming months before this wave (4) has completed.