The Bulls Are Still Alive
Just when you think the bulls’ backs are against the wall, they come up with a day like today. Well, the market pulled back yesterday right into the support I outlined in the afternoon update, and we seem to have rallied off that support today.
Before I begin the analysis, I have a few points I want to make. First, this is something I posted earlier this morning:
“I want to make a small EW point based upon a comment I made this morning that I did not see a bottom yet struck in ES. As you can see, the overnight action was very overlapping, which is why I noted that I did not see a bottom yet struck.
Now, here is the kicker. Even though the economic news was "positive," take note that the FIRST move in the ES was to make a lower low to complete that downside pattern and THEN it turned back up. I find little things like this quite amazing, but you have to maintain a close look at market action to see them.
So, while the market did not develop a bottom overnight, and we then had positive news, the market STILL completed the downside pattern before it turned back up. Interesting.”
The second point is the wholehearted assumption that the CPI report “caused” today’s rally. Yes, I know some of you are rolling your eyes right now asking yourself “Avi, can’t you see what happened today?” Well, to be honest with you, I look past the surface. While it may seem that the CPI report “caused” this market rally if you look at the market superficially, I view it as being a catalyst for a rally that was setting up under two wave counts I have been outlining, as both were pointing higher. (The alternative one pointing lower was clearly noted as a much lower probability in my eyes, as stated in yesterday’s afternoon report).
Moreover, this morning, I got an email on Seeking Alpha by one of my “trolls” who said to me “it is so obvious that the CPI is what caused today’s rally. You have to be an idiot to believe otherwise.” Well, I responded to him by asking him do I have to be an idiot too to believe the CPI report caused the 10%+ rally after it was announced on October 13?
Remember, the last CPI report came in much worse than expected. Yet, the market began a 10%+ rally off that report. So, if I am going to be intellectually honest and consistent, I think it makes much more sense to view these reports as “catalysts” for market moves rather than causes. If they truly were the “cause” of the move then the market would have ended up in the red by 5% of more three weeks ago, especially based upon much of the analysis that was being presented at the time regarding what would be seen if the CPI came in hotter than expected. So, if it you do not believe it is reasonable to view the last CPI report as having “caused” a 10%+ rally, isn’t it equally reasonable to believe it did not “cause” this rally? Again, I am just trying to be logically and internally consistent in my intellectual perspective. So, it is much more accurate to call these reports “catalysts” rather than “causes.”
I hope I am making myself clear about this perspective. This is why I do not even need to know the substance of the report . . . all I need to watch is the market action. The substance of the report is truly immaterial at the end of the day. If I would take stock in the substance of the report, I would have been fighting the last 10%+ rally we saw in mid-October due to being swayed by the “story.”
Now, let’s move onto the analysis.
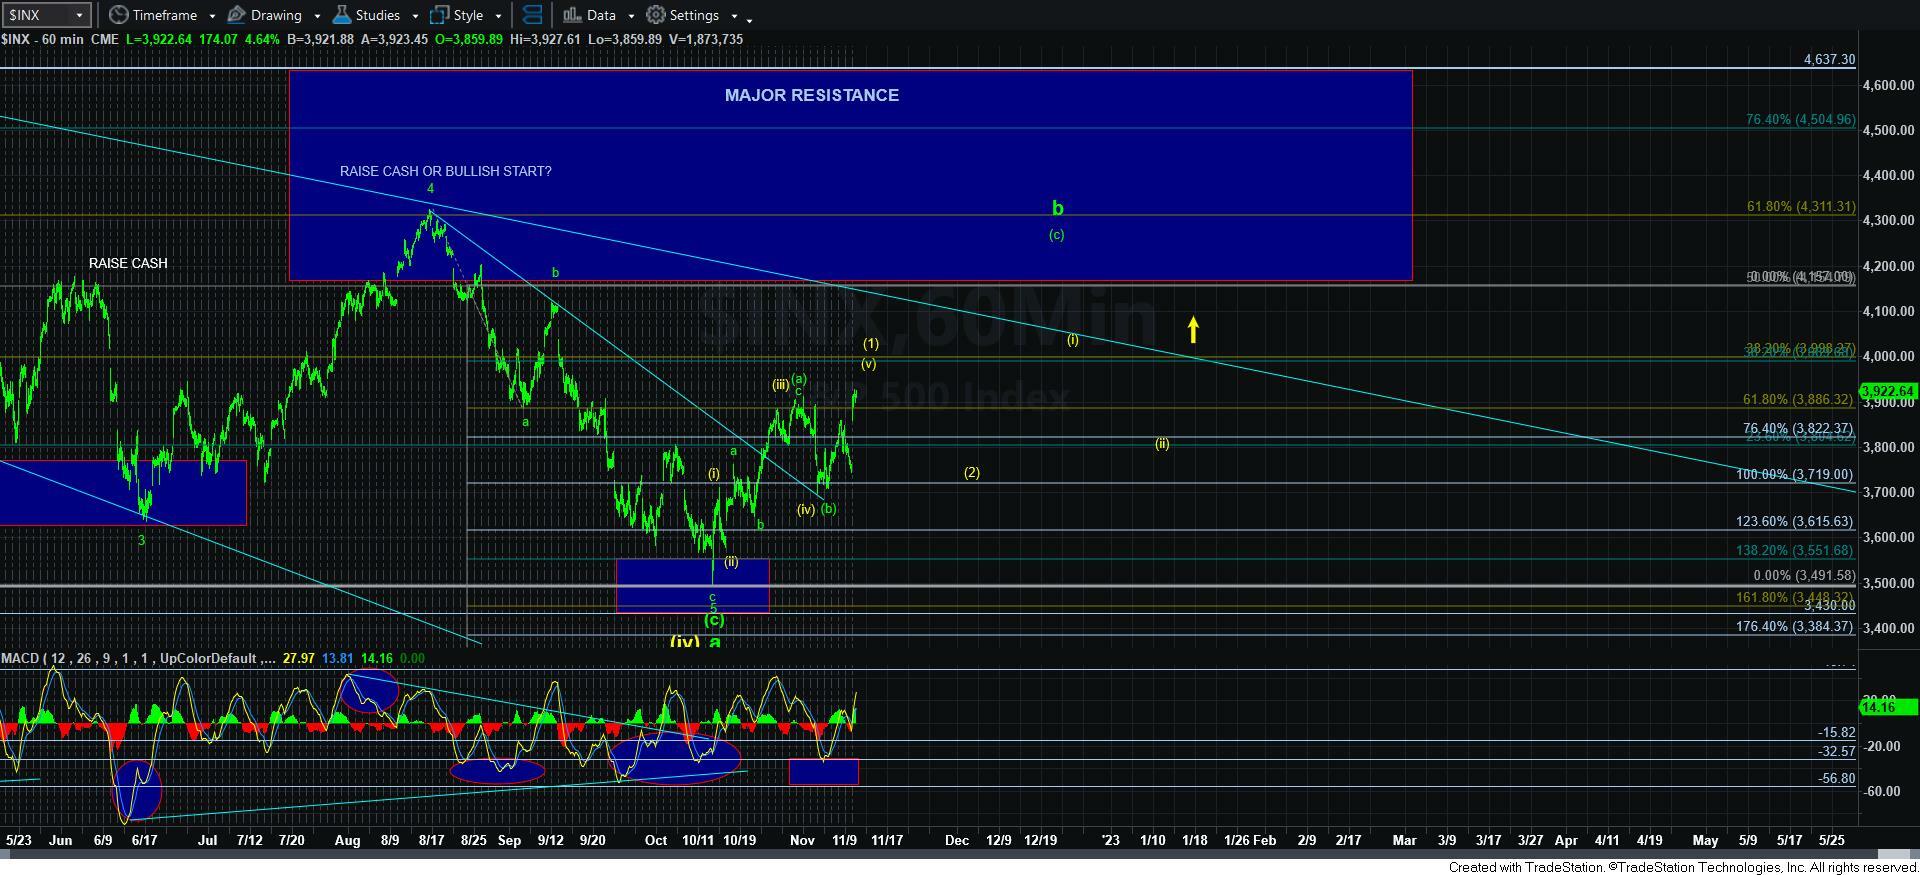
If you have been following my analysis closely from the weekend, as well as in my live video this week, I said that there is one way the bulls can make a comeback. They would need to rally the market to the target overhead for the yellow count to complete a potential wave [v] of wave [1] as a leading diagonal. And, since I do not trust leading diagonals as strong market/investing cues, then I would need to see a corrective wave [2] thereafter, followed by a CLEAR 5-wave impulsive rally that adheres to Fibonacci Pinball for wave [i] of [3]. Should we see that in the coming weeks, then I would again adopt the bullish count as my primary.
But, for now, I still have to retain the “top-is-in” count purely for RISK MANAGEMENT PURPOSES until the market is able to prove otherwise, as outlined above.
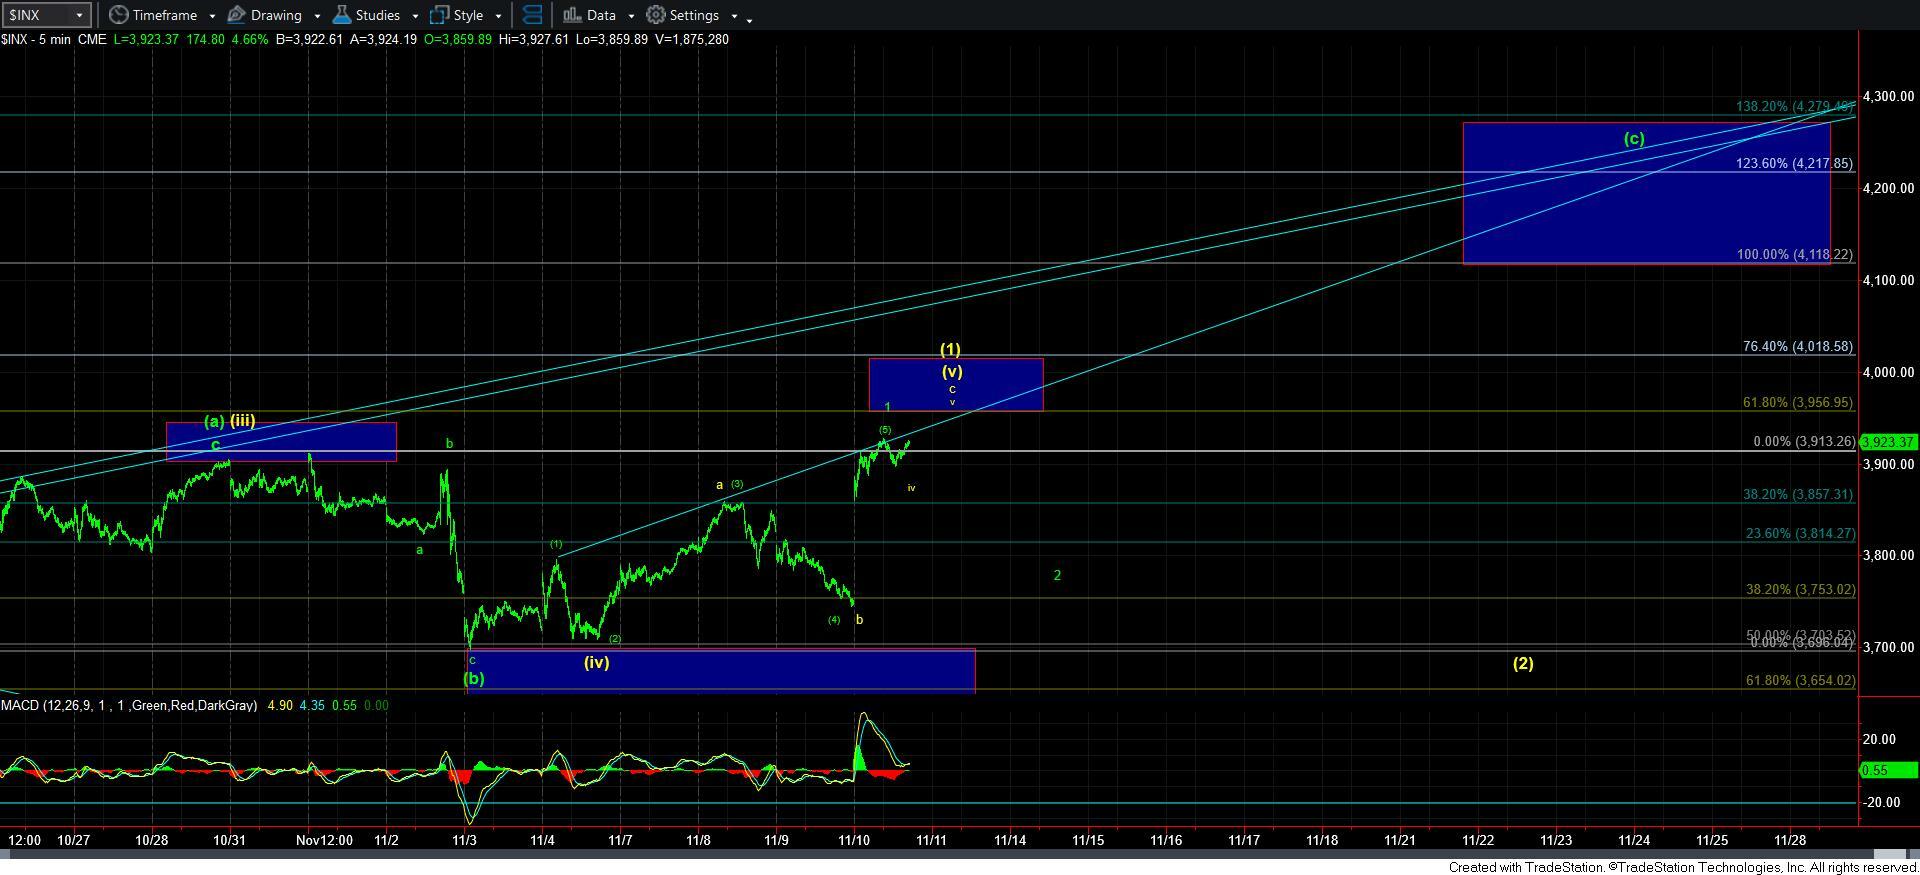
So, what will it take in the micro count for now? Well, as it stands now, 3855SPX is our micro support. And, as long as we remain over that support, then a pullback/consolidation up here can be a wave iv in the yellow c-wave to complete the wave [v] of [1]. The reason I am looking higher to complete wave [v] of [1] at the blue box above is because wave [v] is usually .618 the size of waves [i]-[iii]. And, the bottom of the box is exactly that point. So, it represents a nice target for wave [v] of [1].
Furthermore, the difference between the green and yellow counts will likely also be seen in the depth of the next pullback, as the green count will be more shallow, as its standard retracement region (.382-.618) is a higher target than then one in the yellow count. Therefore, we will have continued guidelines to follow in the coming weeks before we can be more certain of becoming more aggressive on the long side.
But, as I noted in the room as well, while I still expect that we can rally back to 4100+ in the coming months, I don’t think we are ready to do so just yet, as we likely need a corrective pullback first – either the green wave 2, or the larger yellow wave [2]. So, once we complete this market strength, and as long as the next higher resistance box is respected, I am expecting another pullback over the coming week or two.
For now, I am looking for more clues as to which pattern the market is tracing out – yellow or green. And, until yellow proves itself as outlined above, I intend to follow green for RISK MANAGEMENT PURPOSES.