Testing Support For Immediate Bullishness
I am not supposed to be here right now, but I wanted to at least put out a morning note about the market action today.
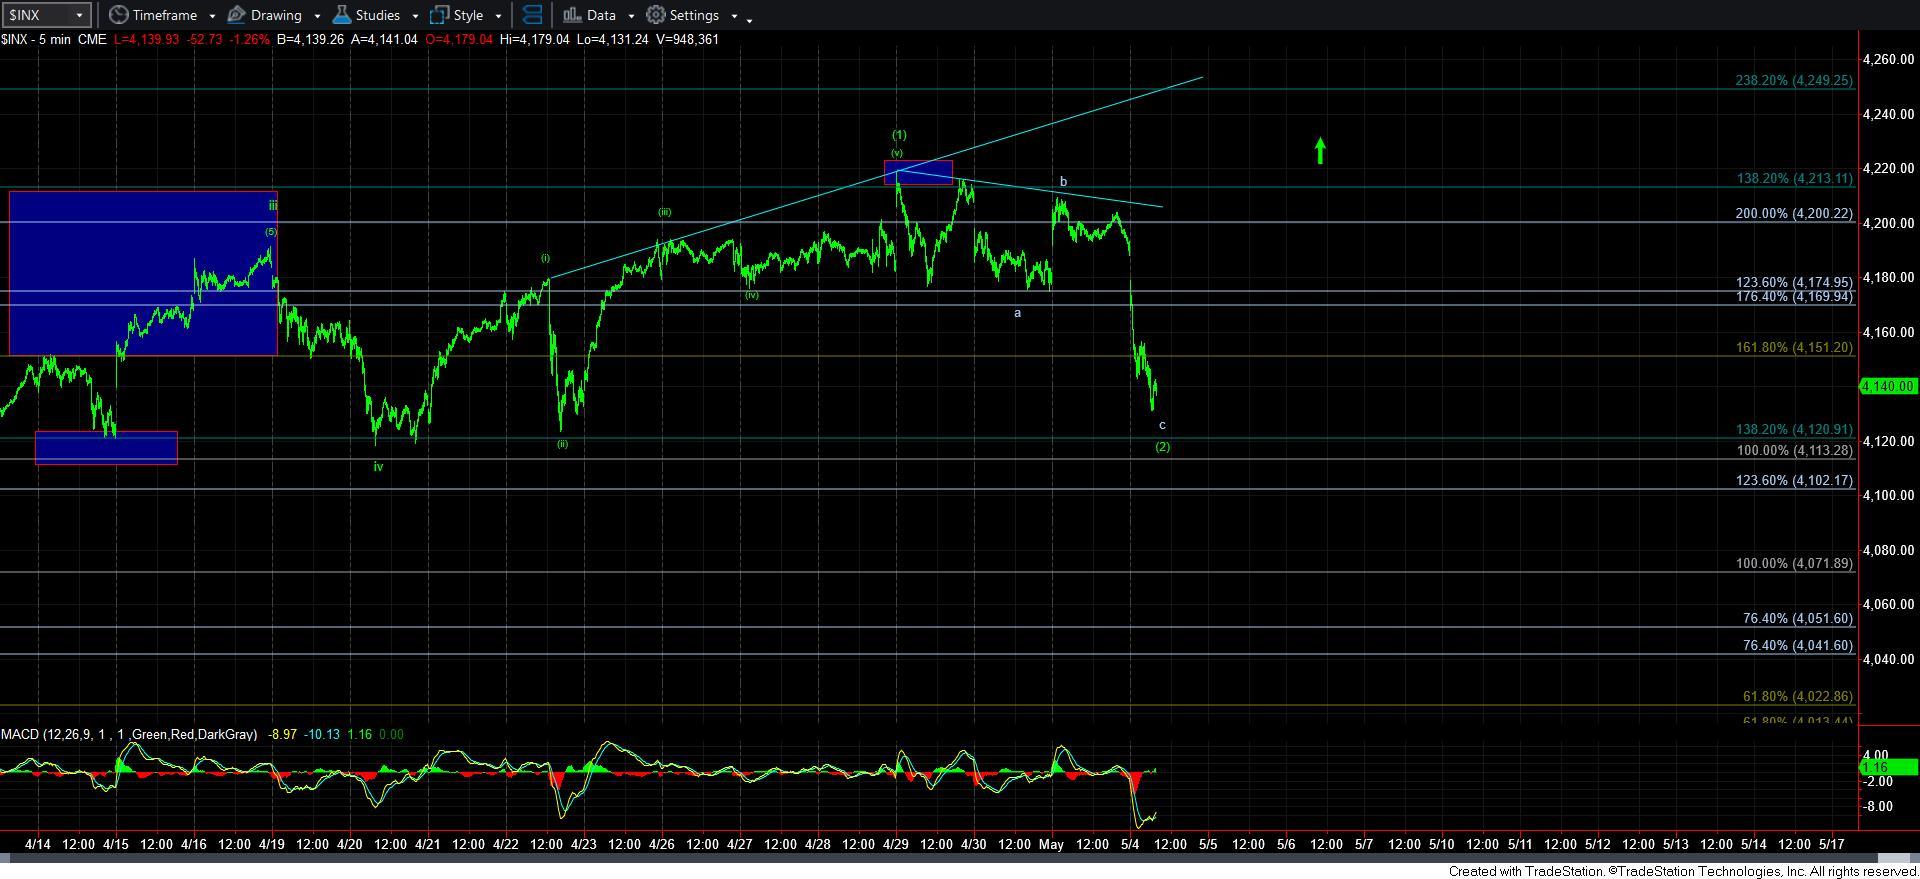
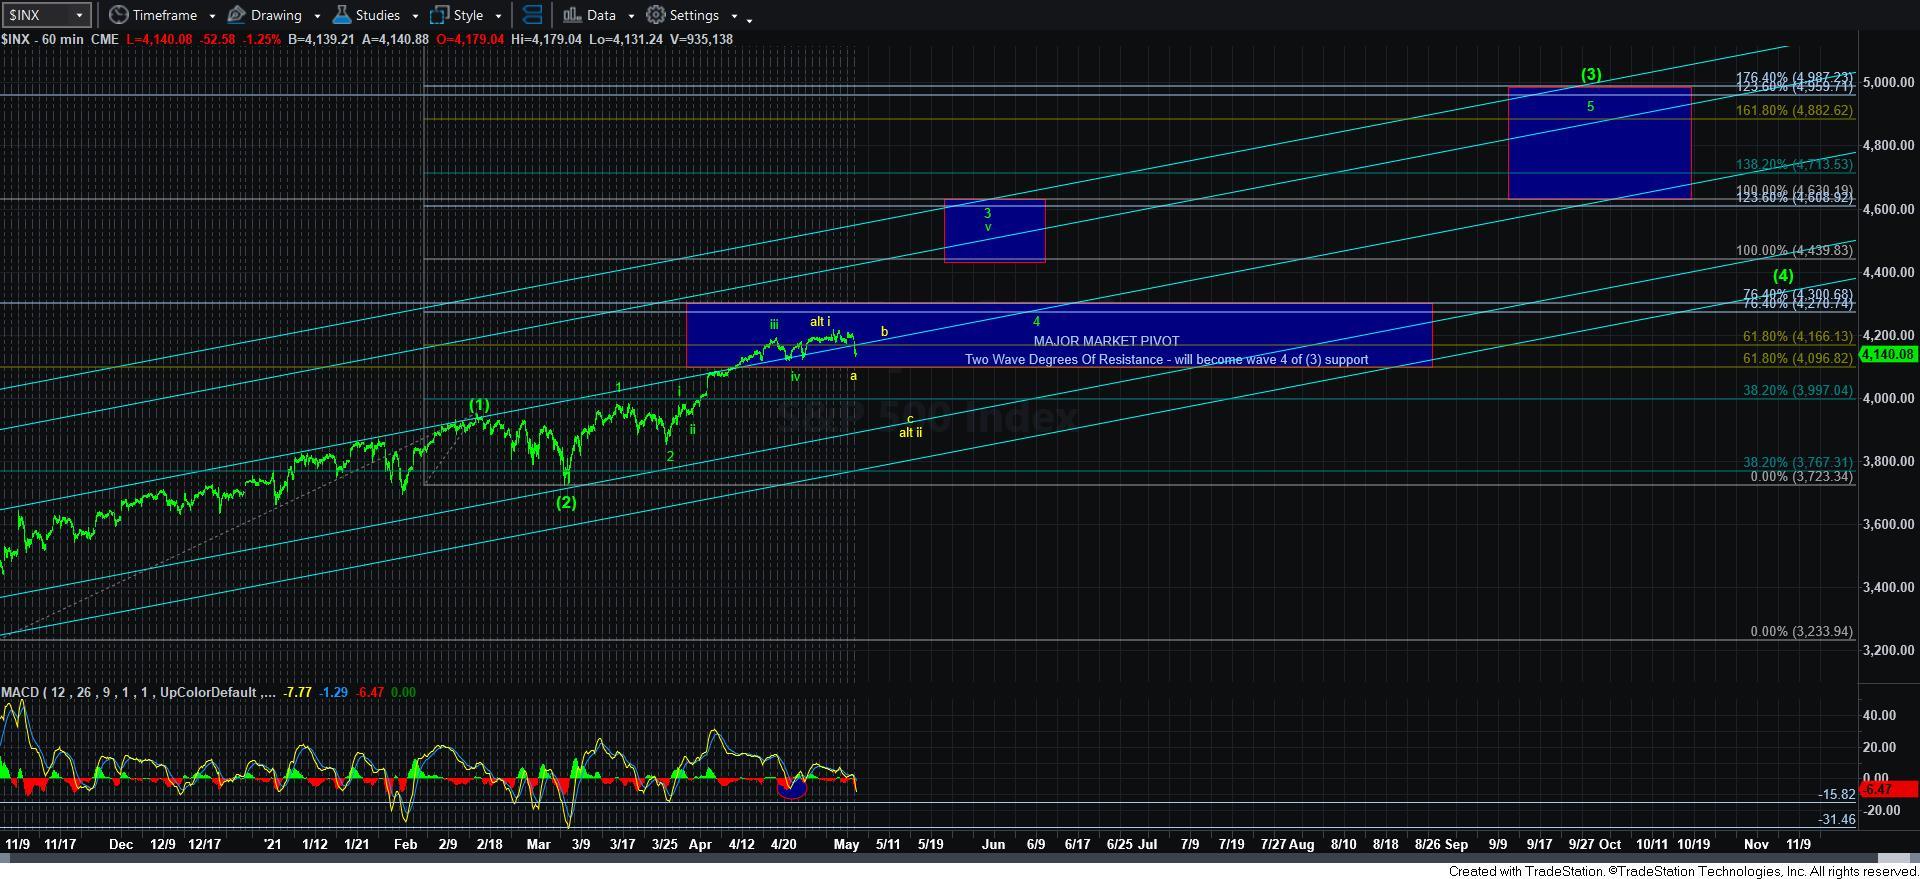
We are testing the 4140SPX lower end of support I have been referencing. But, it seems we are testing it with what may be a 5th wave of a c-wave down. What that means is that we can see a spike below 4140, with a reversal back over it. If this is how we close out the day, then I will likely be viewing today's drop as completing the wave [2] in blue I have been tracking as an alternative. This would project a bit lower than the ideal 4400SPX region target I have for wave 3 on the 60-minute chart, but a break out back over the recent highs would likely provide us with extensions that can take us to 4400SPX.
However, if we maintain weakness over the coming day or so, then I have to switch gears and move towards the yellow count. That would suggest this is an a-wave within wave ii, likely to be followed by a multi-day b-wave bounce. Thereafter, we can see a strong c-wave decline which has an ideal target in the 3900-3950SPX region, which would project waves iii, iv and v to complete in the upper end of our target box for wave 3 in the 4600SPX region.
So, I think we have a bit more action today to see before we can be more certain that we have to move towards the yellow count at this time. And, a break of 4120SPX would invalidate the potential for wave [2] in blue.