Testing Support Again - Market Analysis for Nov 20th, 2025
The manner in which the market has been trading of late is more indicative of a top having been struck. When we broke this week’s pullback low today, it started to increase the probability that a high of sorts is now in place, and that 7000 is going to be put off for now, if not for many years to come. But, of course, we seek confirmation.
Based upon the manner in which the market has been moving back and forth up here, I cannot say there is a clearly defined impulsive 5-wave structure having developed for a c-wave decline here. Rather, if the market does break down, it is starting to look more like the yellow c-wave is taking shape as an ending diagonal. And, there is some interesting coincidence with the targets of that diagonal and the support regions on our larger degree charts.
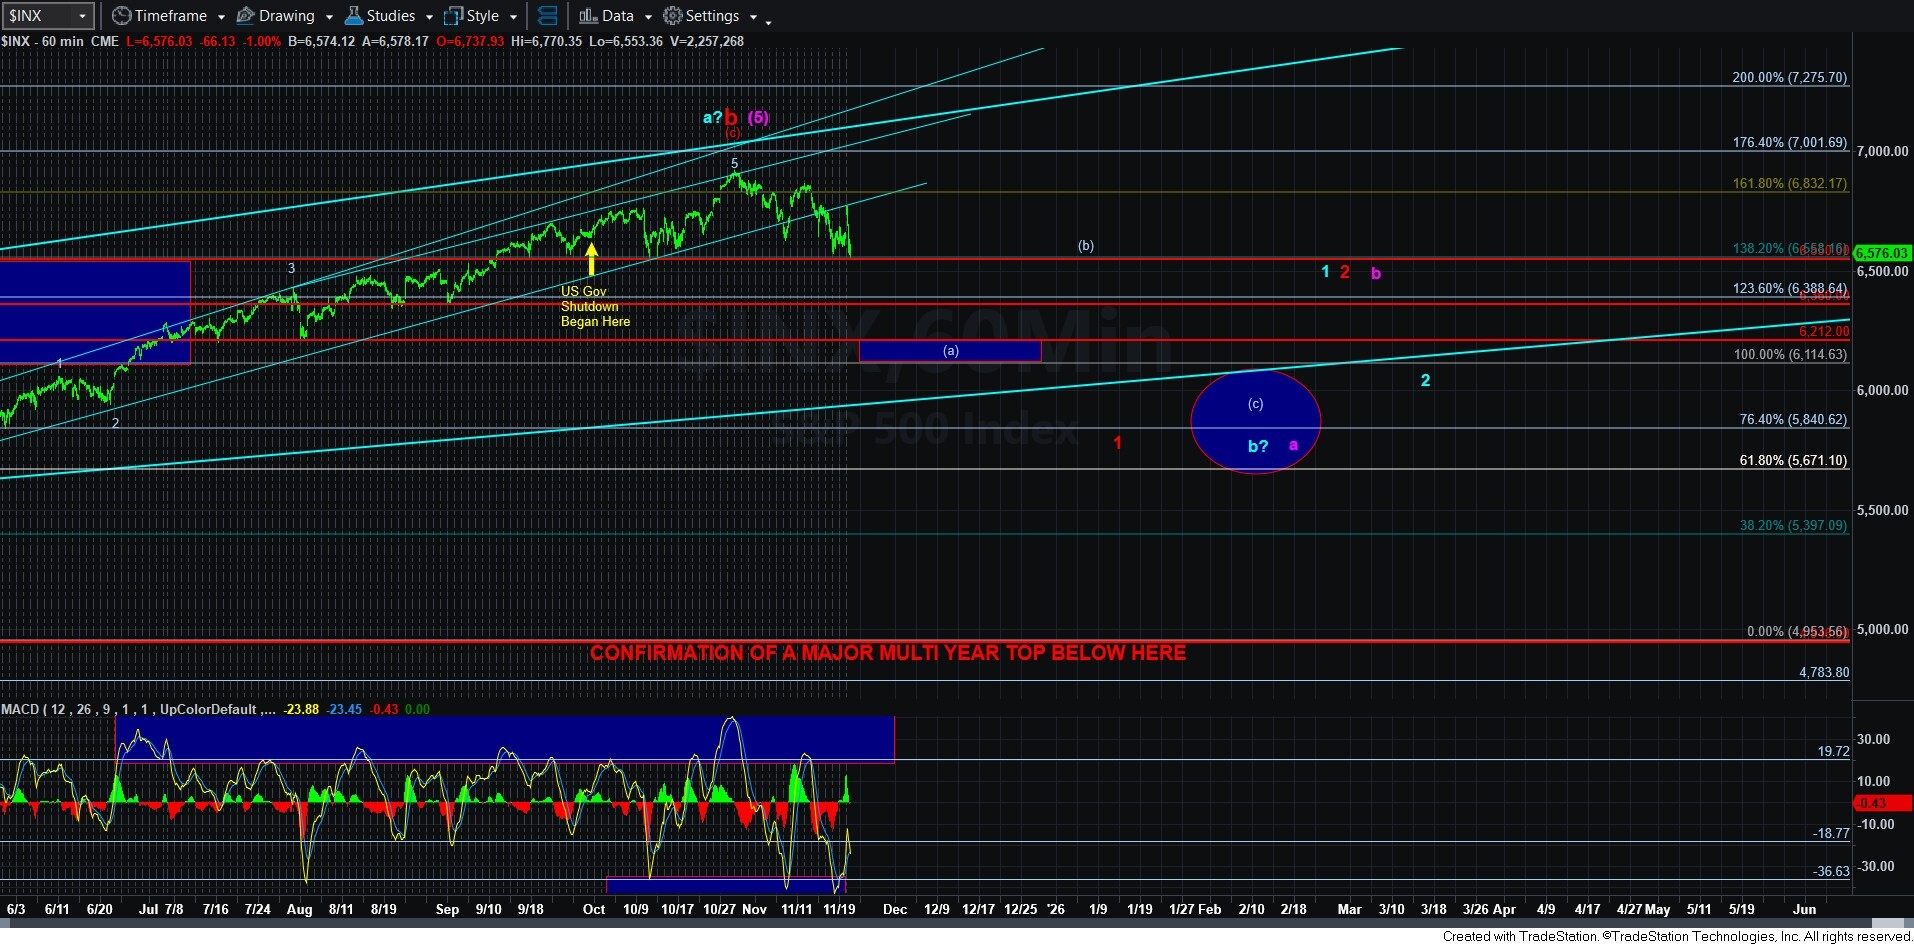
As you can see my labeling for wave 1-2 on the 5-minute chart, it would suggest that a sustained break down below the important 6550SPX support region will open the door to our next downside support in the 6360SPX region. If you remember, wave 3 in a diagonal often targets the 1.236-1.382 extensions of waves 1 and 2, which in our case is the 6360-6404 region and noted as our wave 3 box. Thereafter, we can see a wave 4 bounce back to resistance in the 6550SPX region, followed by a decline towards the 6200 region for wave 5, which also coincides with the general (a) wave target we have on the 60-minute chart.
But, again, until we actually see a sustained break of the 6550SPX support, we have no clear confirmation that a top is in place. But, should that break down occur, then it makes it likely a top of sorts is now in place, and the market will likely tell us in the coming months whether we will go back up to the commonly-expected 7000 region and potentially higher. We have outlined these paths ad nauseum over the past 6 months, so I am not going to repeat it again right now. As the market makes its way lower, we will again address these parameters.
For now, we are watching to see if we can finally see a break down below the 6550SPX support. And as of my writing this update, I cannot say that I have a clearly identifiable path to new highs at this time. As long as today’s high remains intact, pressure is now down and the bears can take control of the market for at least the near term. So, it seems as though the market may finally attempt to break that initial support region, which can lead to a decline towards the next support in the 6360SPX region.