Testing Support - Market Analysis for Nov 30th, 2023
Today, we find ourselves testing the top part of our support region on the SPX. So, we still do not have a clear indication that we have topped.
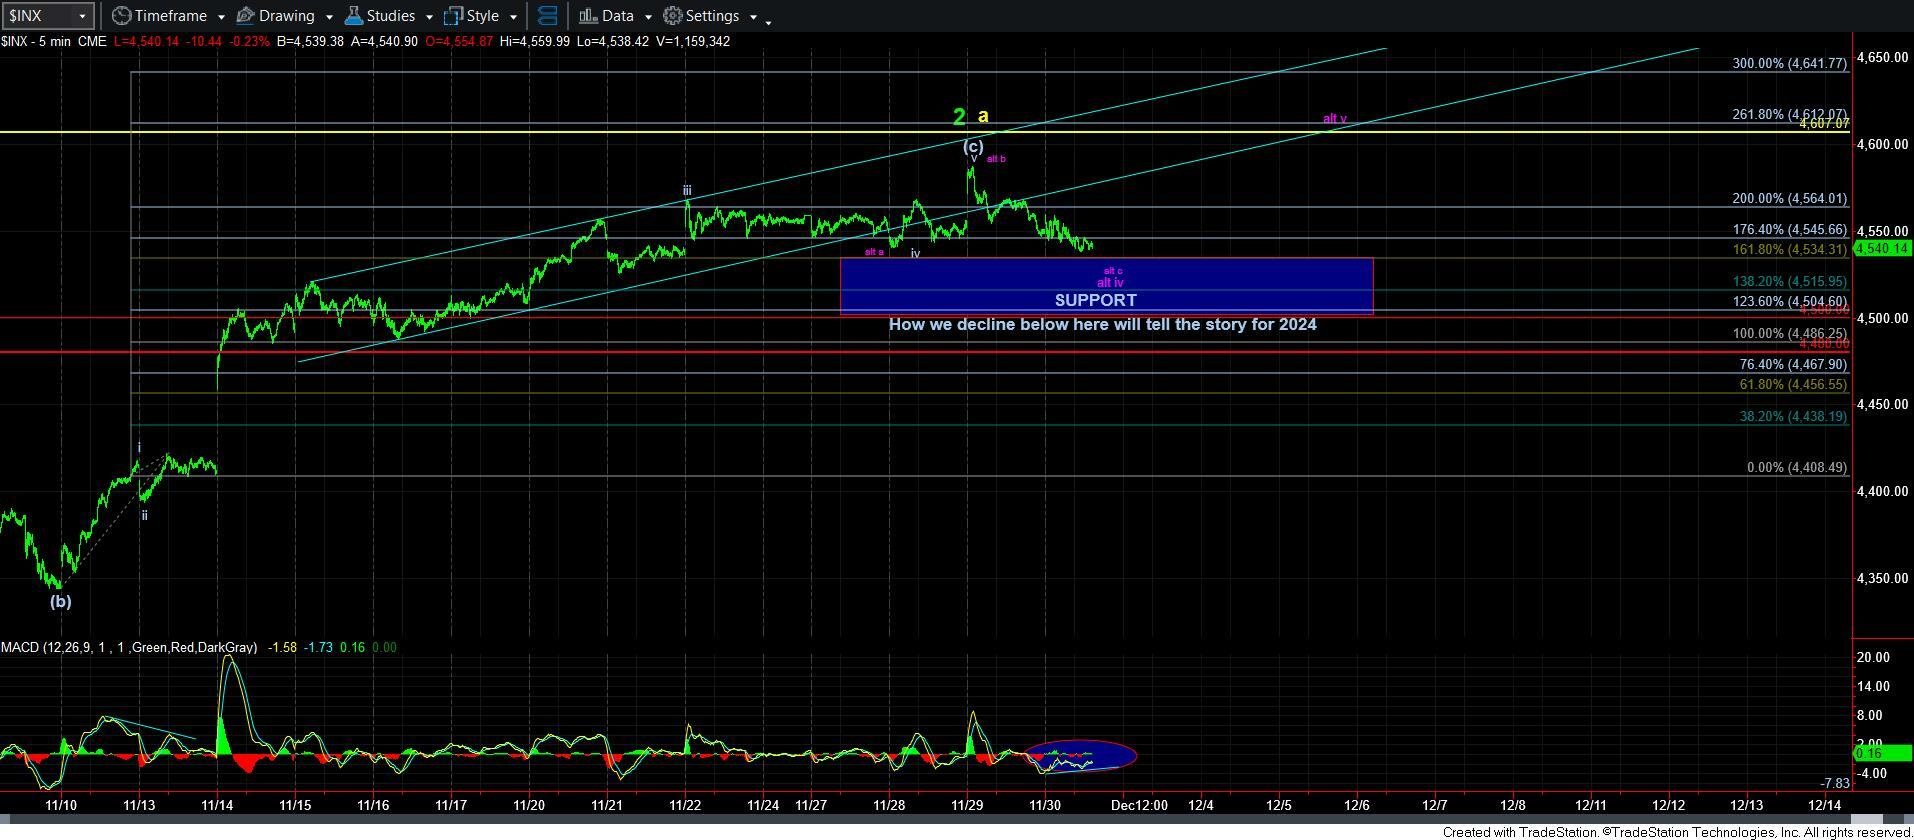
Now, while we have broken below what I currently have labeled as wave iv (if the top is in), I have to note that I am questioning that potential since the rally to yesterday’s high really counts best as a 3-wave rally. As I have it labeled in purple on the 5-minute SPX chart, this could simply be a more complex wave iv, setting us up for a test of the prior highs in wave v.
So, if the next rally is clearly corrective, then we assume that the top is in place, and we will likely break down support by next week. However, if the next rally is clearly impulsive, then we will be looking higher for alt v in purple. And, once we see waves 1-2 of that purple alt v take shape, we can gain a better idea as to just how high the wave v will project.
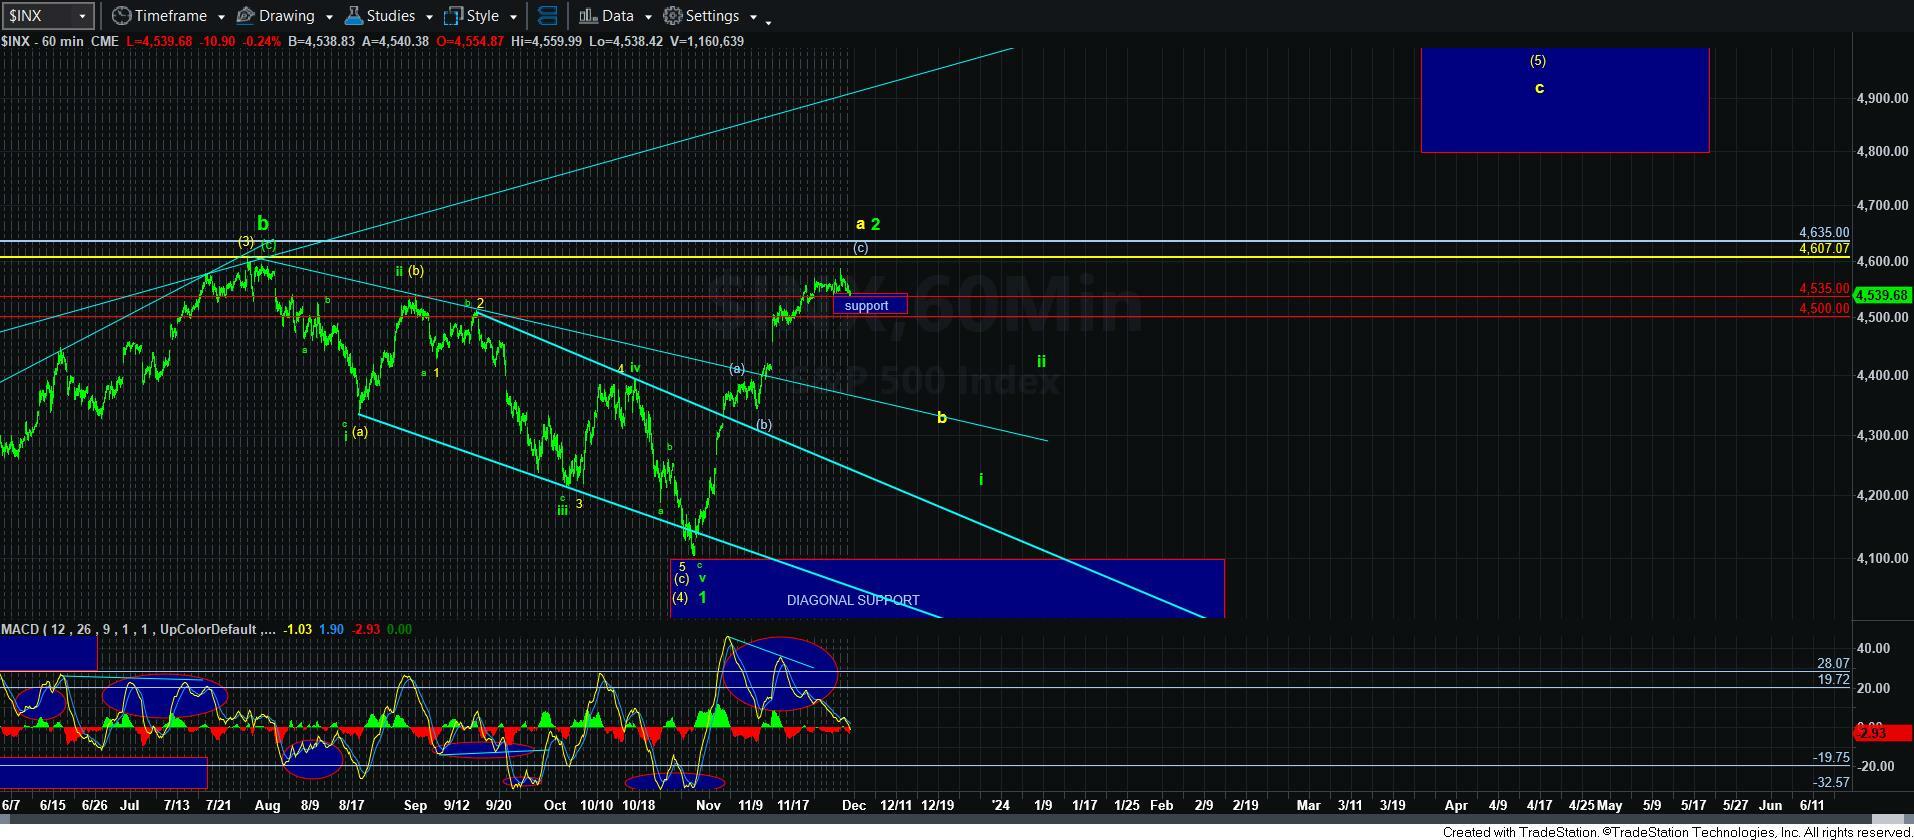
Moreover, due to the drop in the MACD on the 60-minute chart, it would not at all surprise me to see the market attempt another rally before we strike a top in the [c] wave.
Of course, this is speaking about the micro count. Nothing has really changed on the bigger picture, as we still need to see if we are able to take out 4607.07 first, or if the next decline below support will be corrective or impulsive.