Testing Support - Market Analysis for Feb 21st, 2019
I sat down to write this update this evening (well, to be completely honest, I was already sitting), and then thought back to what I was outlining through the day, and I don’t think I can come up with a better summary than what I posted earlier today. So, I am going to reprint that here:
Allow me to organize my thought for the lay of the land in one post now.
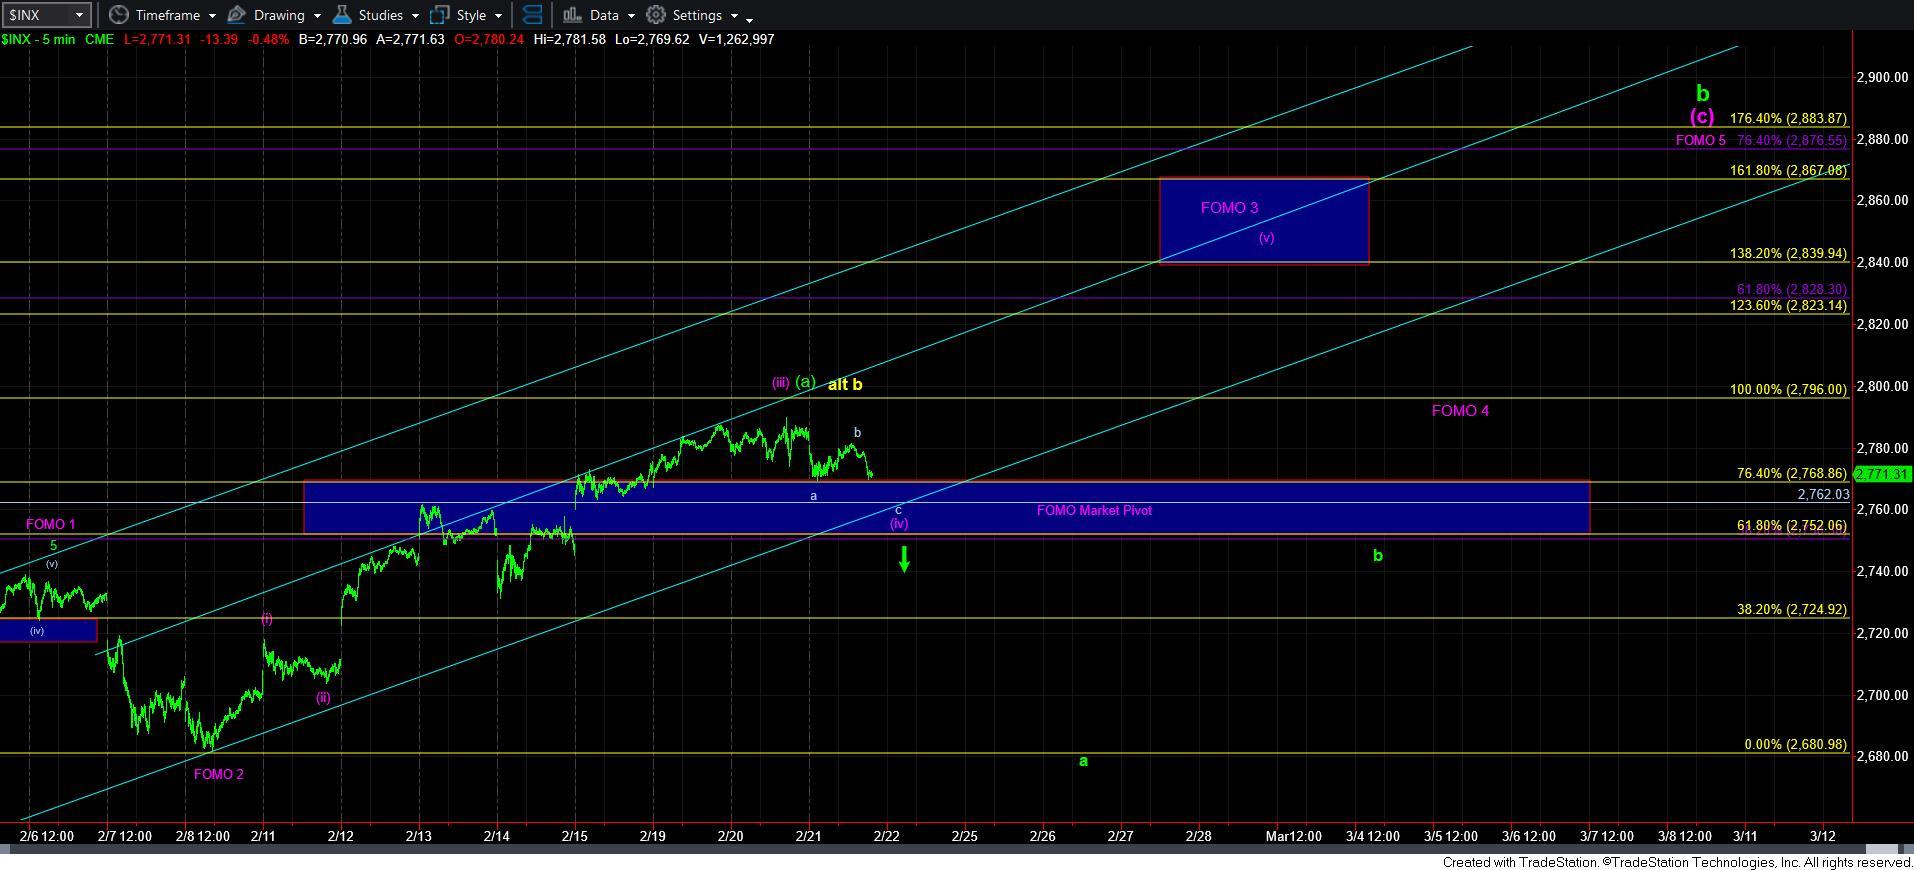
First, I am going to slightly modify the FOMO count, as shown on the attached 5-minute chart, based upon the fibs we have been hitting and the reaction from those fibs.
Again, I want to STRONGLY stress that a break of 2770SPX is only the initial indication that this uptrend is broken. WE MUST follow through below 2750SPX to really take this potential off the chart.
Moreover, in this count, it is much less likely we will attain a full [a]=[c] in the FOMO count - should it hold. Rather, it seems to more likely be pointing to the [c]=.764*[a] at the 2875SPX region.
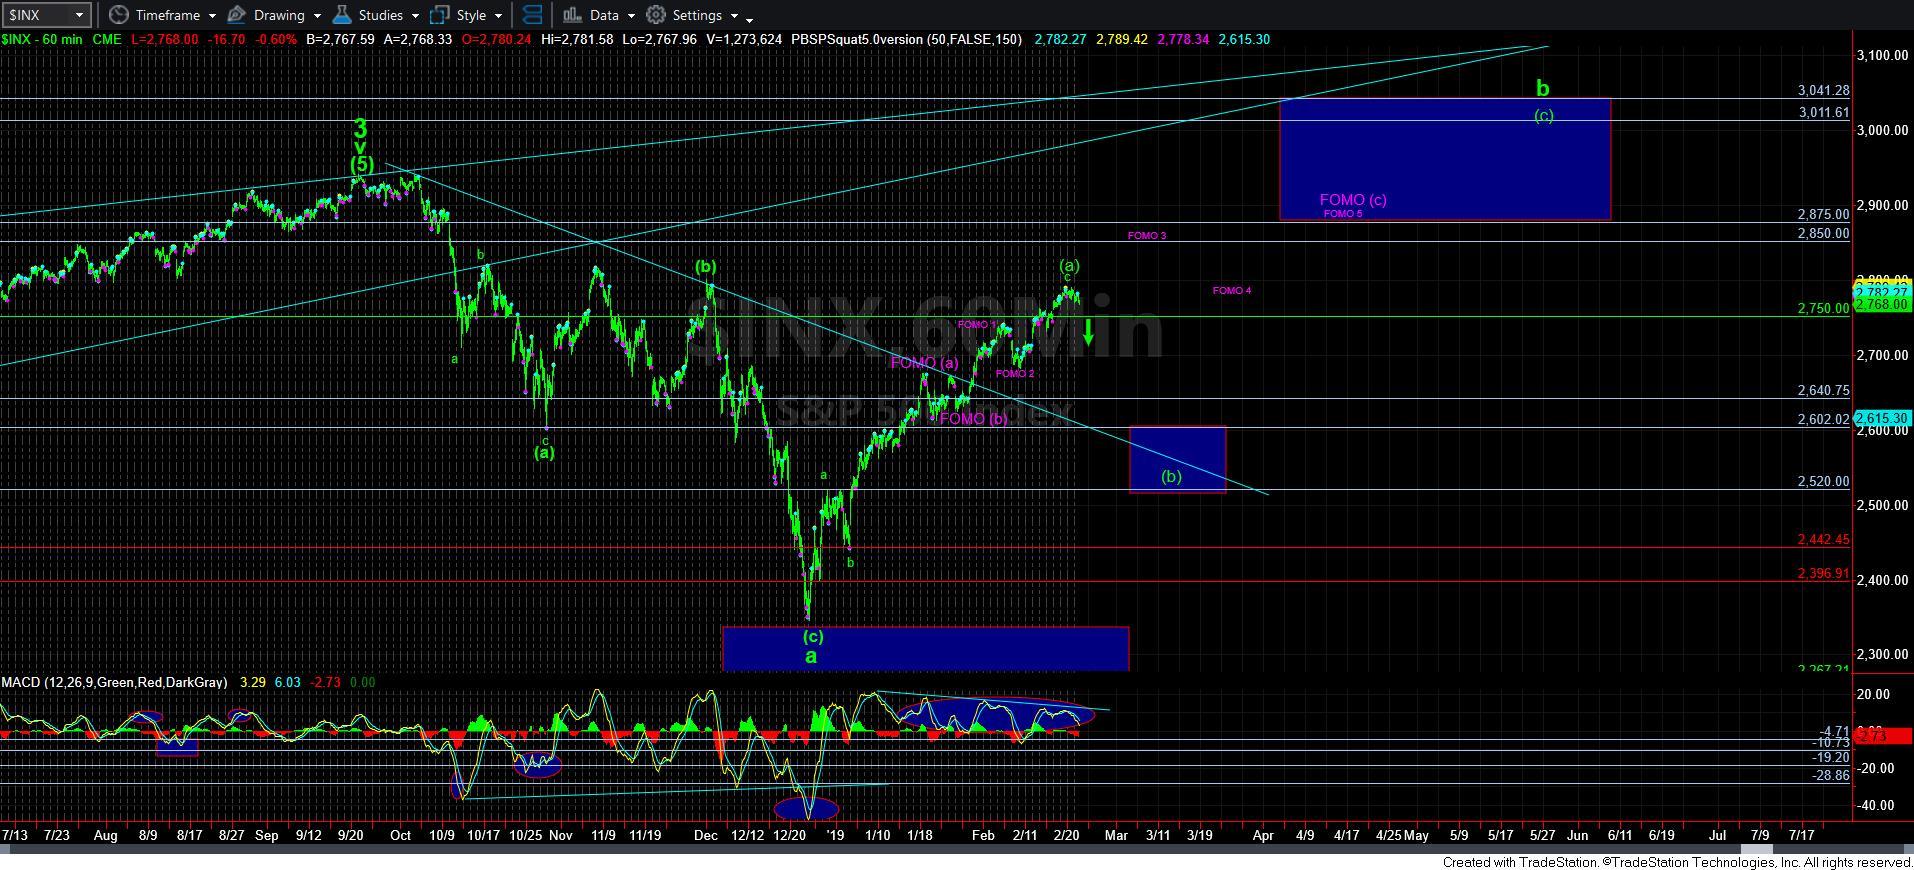
Second, should we see follow through below 2750SPX in the coming days, then I think the green count is the more likely count, at least at this time. If we see a clear impulsive 5-wave structure break us down below 2750SPX, only then will I assume it is the wave 1 down in the c-wave, meaning that the yellow b-wave has topped.
So, for now, 2750-70SPX still remains the important pivot, as represented on our chart. As long as it holds, the bulls are still in control. However, the manner in which we may break that support will tell us if the yellow or green count is controlling, with my expectation for it to be the green count for now, unless proven otherwise.
Now, I want to explain why I modified by FOMO count as shown in the 5-minute chart. Wave [iii] of 3 will target the 1.236 extension of waves 1 and 2, or the 1.00 extension of waves 1 and 2. I was initially targeting the 1.236 extension, since that would project this [c] wave in the FOMO count to the [a]=[c] target in the 2950SPX region. However, with the pullback we have seen today, we have now topped out at the 1.00 extension, which would likely suggest that the wave [iii] of 3 topped at the 1.00 extension of waves 1 and 2, which also modifies my expectation for this b-wave rally in the FOMO count to the 2875SPX region, as noted above. So, I hope that explains why the modification in the FOMO count.
But, as I have also noted, the market will have to break down below the 2770SPX support, and follow through below 2750SPX region to suggest that we are not following through in the FOMO count. That would then move me into the green count, which has still remained on the chart. And, as long as we hold this support, then my next target is wave [v] in the FOMO count to the 2840SPX region, as shown on the 5-minute chart.
Alternatively, if the market can break down below 2750, then I will be targeting at least the 2600SPX region for a [b] wave pullback, as shown in green. But, if the drop below 2750SPX is clearly impulsive, then I will then adopt the perspective that all of the b-wave has ended at the minimum target we set for it many months ago in the 2800SPX region. But, barring a clear impulsive 5-wave break down below 2750, any break of support would be more suggestive of a corrective retrace, which can be bought.
For now, the market is testing support between 2750-2770. How it handles this test over the next few days will give us our indications over the next month or so.