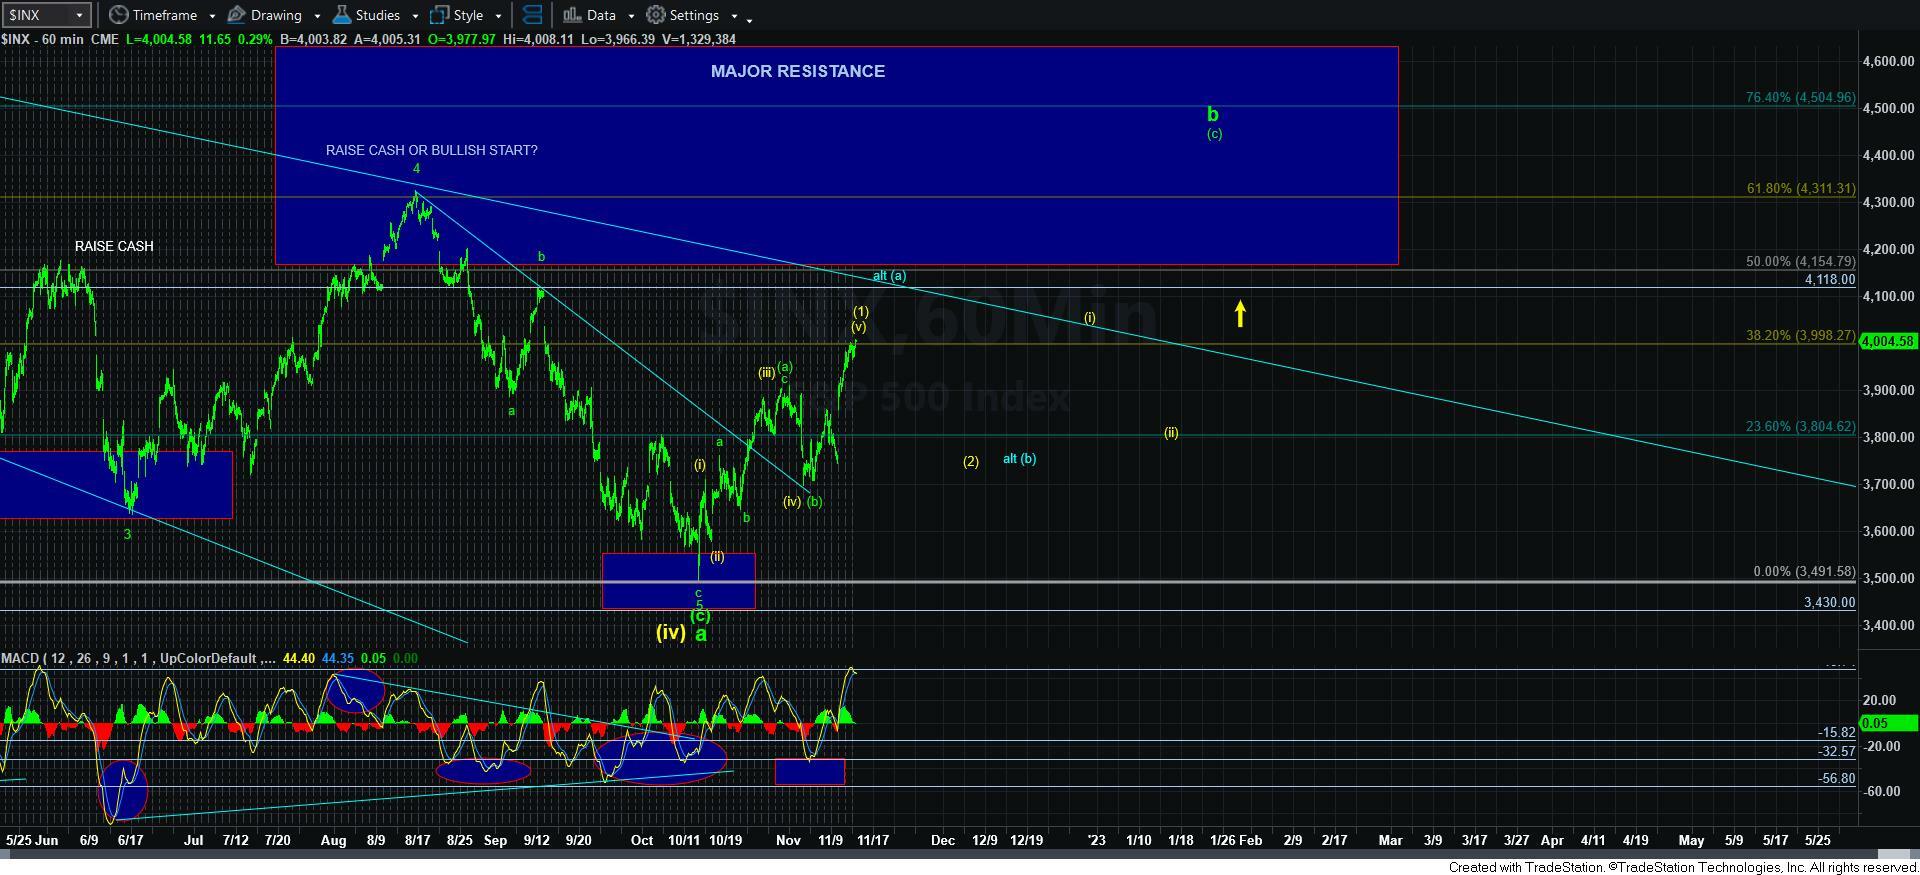
Testing Resistance - Market Analysis for Nov 14th, 2022
Thus far, the market is simply consolidating below resistance. So, we have no indications yet that a top has indeed been struck.
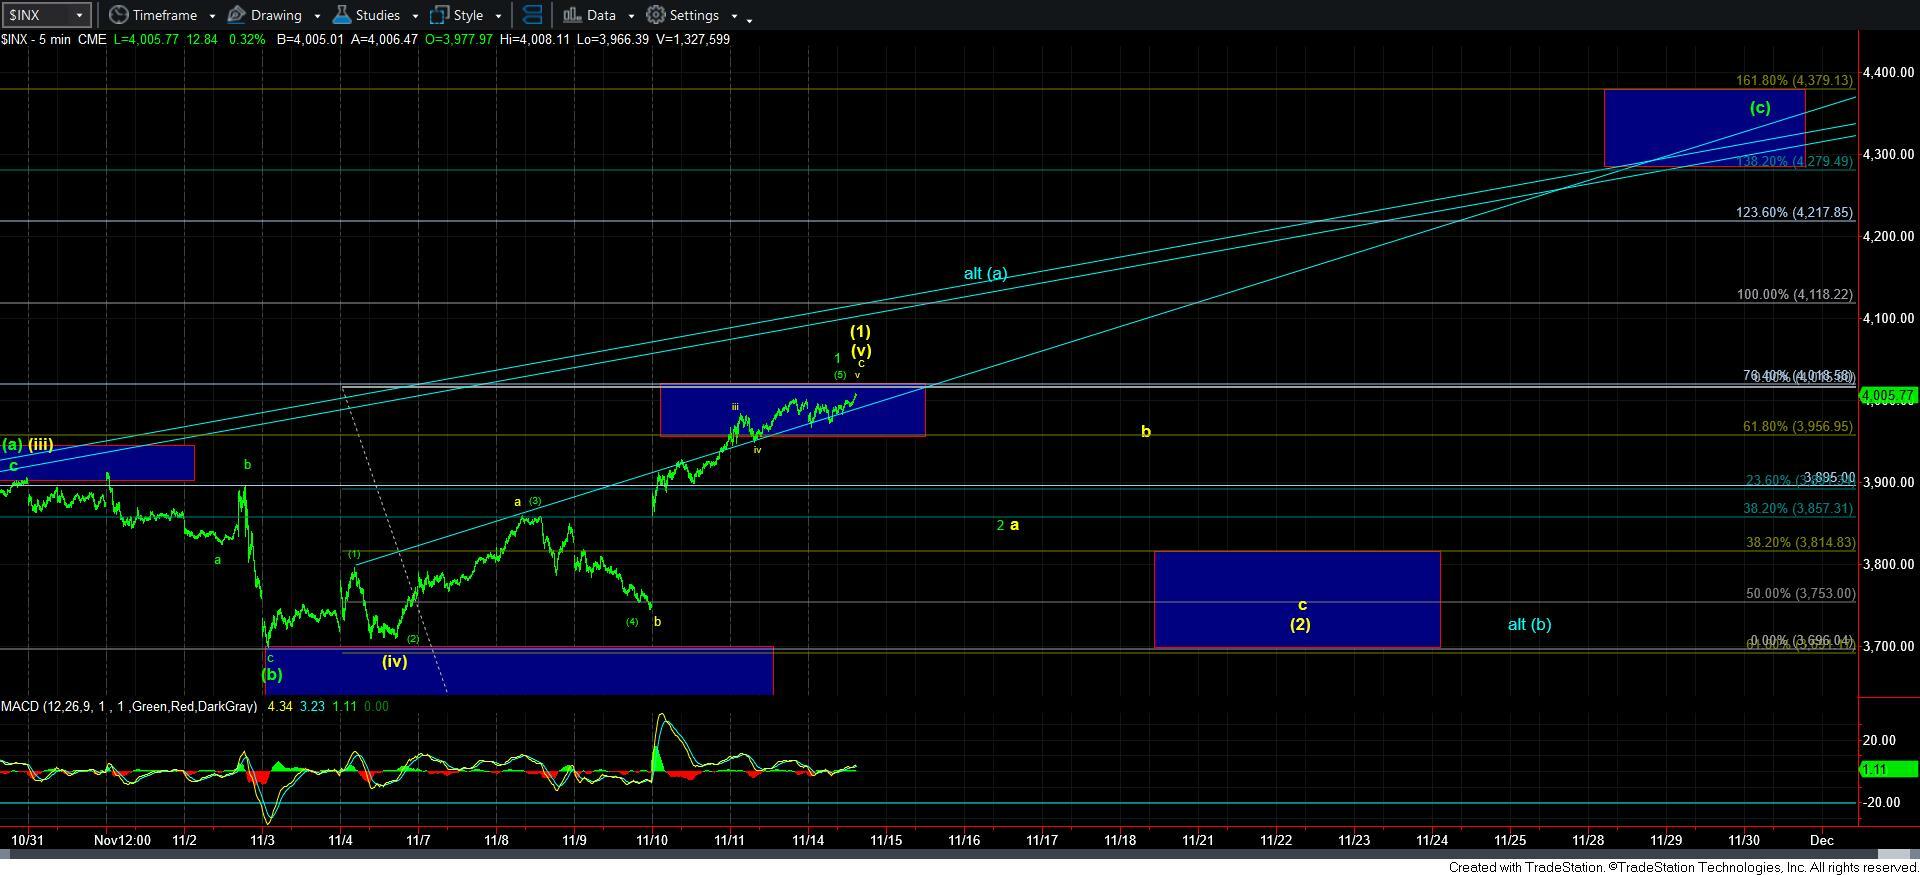
But, there really is not much more I can add to the detailed analysis I provided over the weekend. Micro support is now at 3966SPX and we need to break down below that level to provide an initial signal to a top. However, we really need to break 3895SPX to confirm that we are either in the a-wave of yellow wave [2], or in the green wave 2.
The difference between those two counts will depend on how we would rally off that low. If corrective, then it would be the b-wave in yellow. If it is impulsive, then we are likely starting the 3rd wave of the green [c] wave higher.
Now, as noted in the weekend update, if we see a strong move through 4020SPX, then we have to take the blue count much more seriously. It would suggest that we could see a direct move to the 4118-4154SPX region before a larger pullback is seen in the blue [b] wave.
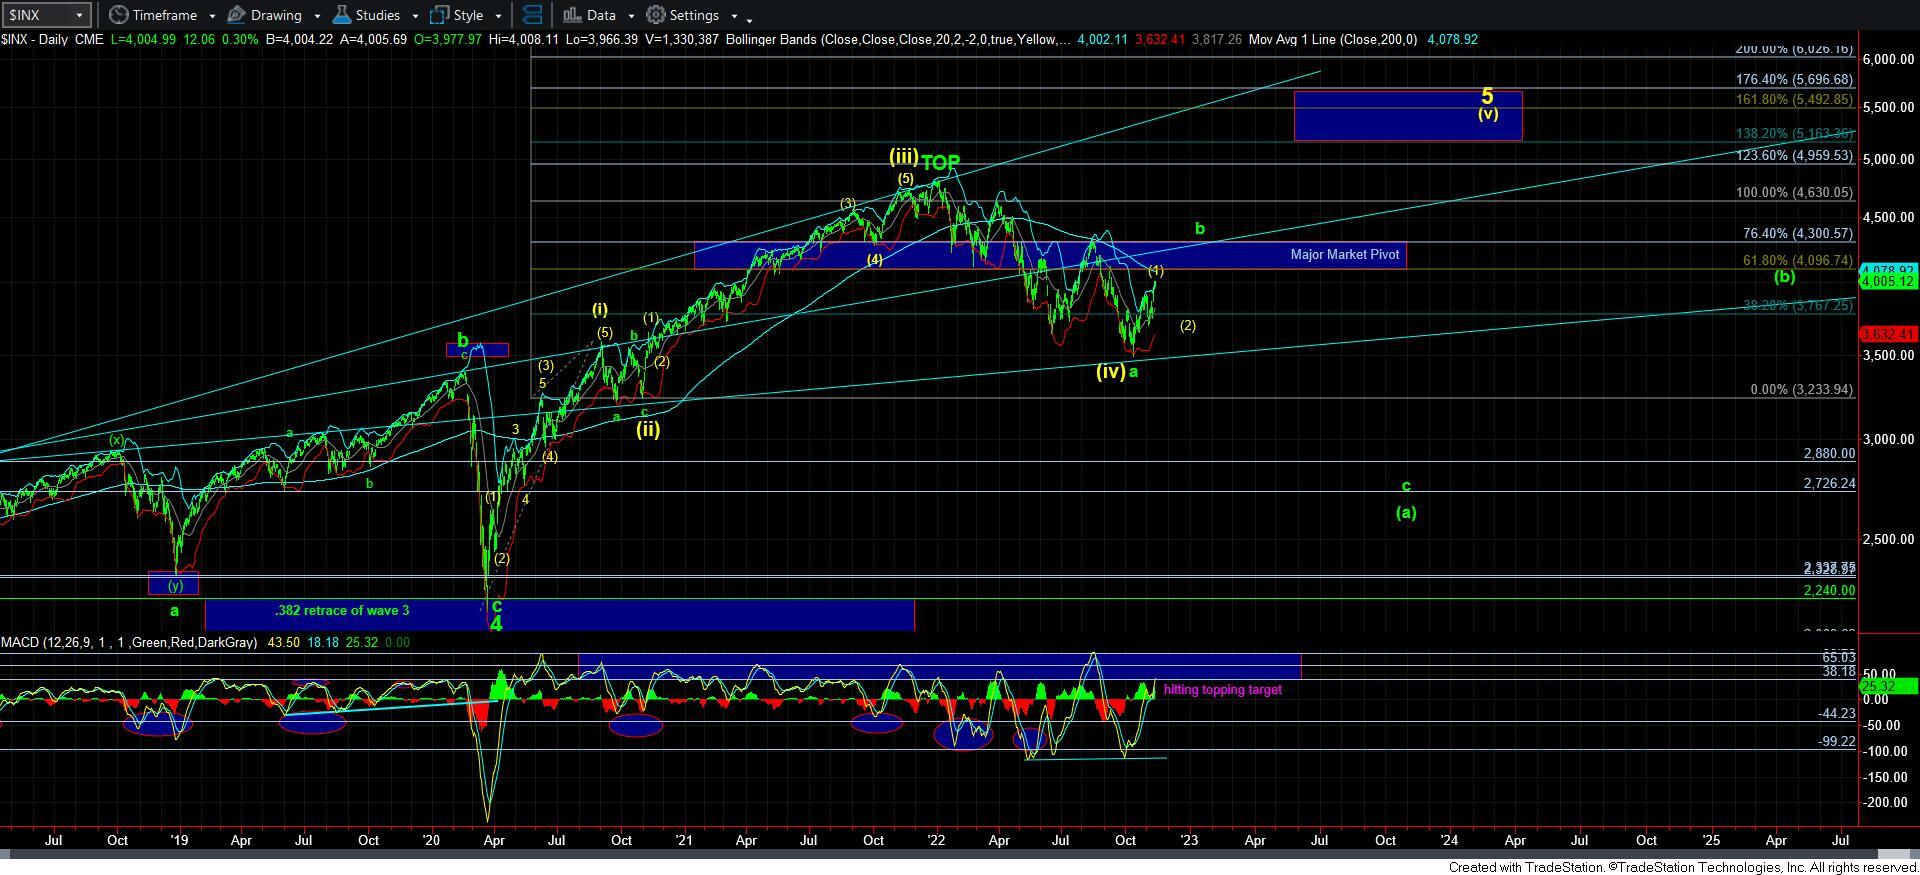
So, the parameters are generally the same other than the micro support being moved up to today’s pullback low. But, do take note that the SPX daily MACD is now in the bottom of our resistance region.