Testing Next Resistance Region
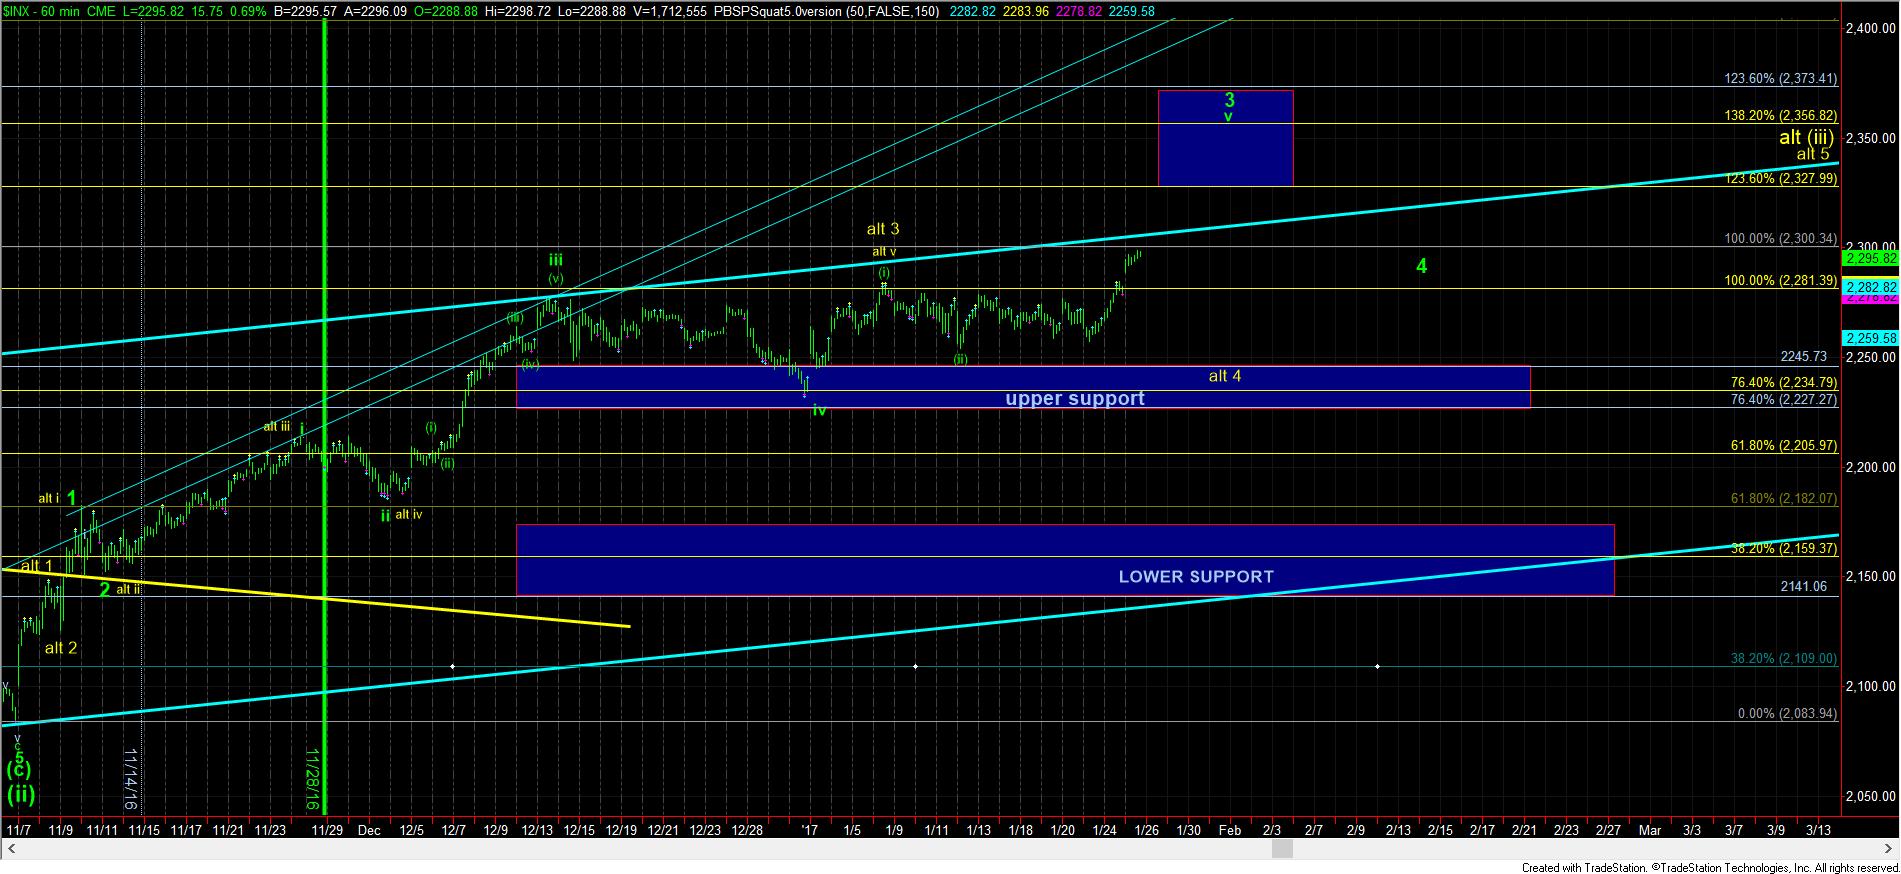
As the market continued to climb today in wave v of 3, we have bumped our heads on the next resistance region between 2300-2310SPX. There are several major and minor Fibonacci extensions residing in that region, along with the long term trend line just overhead.
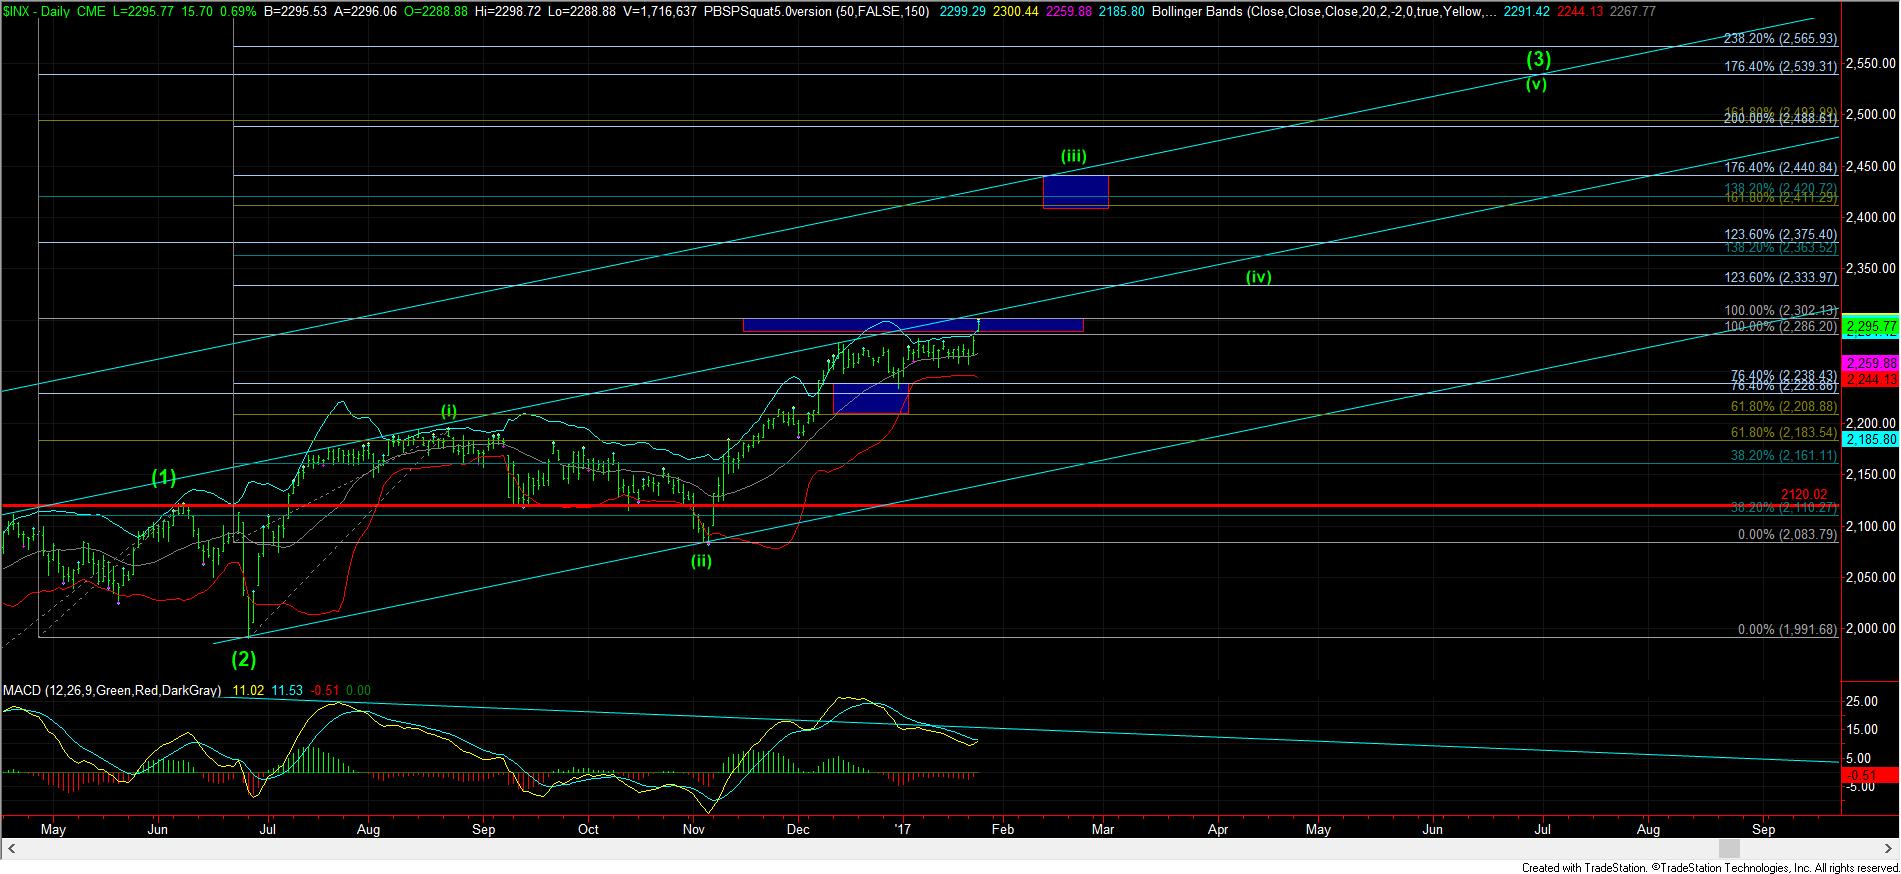
I want to show you the daily SPX chart again. What is often seen in a 3rd wave is that the market moves from one channel to an upper channel during the 3rd wave. We are at the point now where the market is going to have to make a decision as to whether it wants to take out this resistance, and provide us another melt-up phase within this larger degree wave (iii), which would be pointing us towards the 2400SPX region by spring time.
If we are not able to develop that melt-up phase into the upper channel, then we will likely just grind higher in a series of 4’s and 5’s until we reach our ideal target over 2500SPX.
So, the market has approached yet another test and it will likely let us know soon just how bullish it wants to be for the next few months. But, my expectation is that our next higher target region resides between 2330-2375SPX, with the ideal target being the 2.00 extension of waves (i) and (ii) of wave v in the 2350SPX region.