Testing Initial Support - Market Analysis for Sep 18th, 2019
While I am clearly not smart enough to opine about the Fed action and what it means to the market, I can provide levels and structure to watch to know which way we are heading for the next larger degree move.
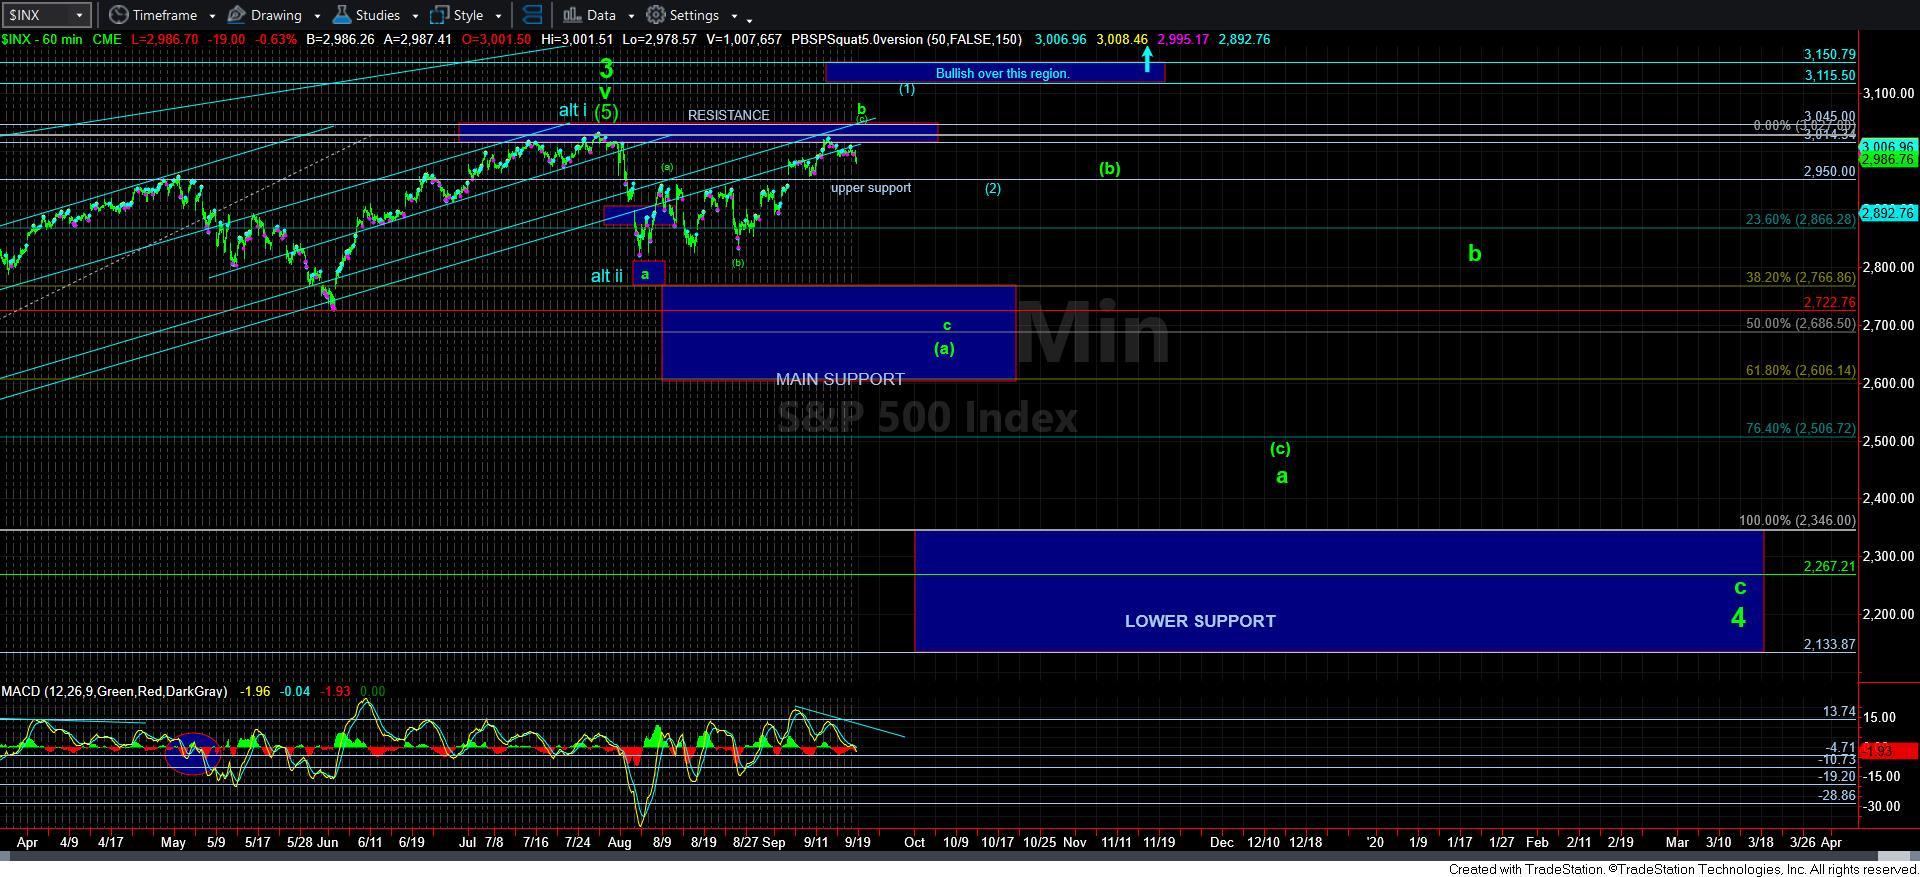
Last night, I noted that I can count an initial 5 waves down in SPX whereas I do not have the same pattern in the futures. But, If the SPX count is applicable, we are now testing the 1.00 extension off that high in the 2975SPX region. If this is a corrective structure off the highs, then this region should hold as support.
Should we break 2975SPX then the question will be if the market is able to continue down to complete 5 waves down off the SPX high. That would project us into the 2950SPX support region.
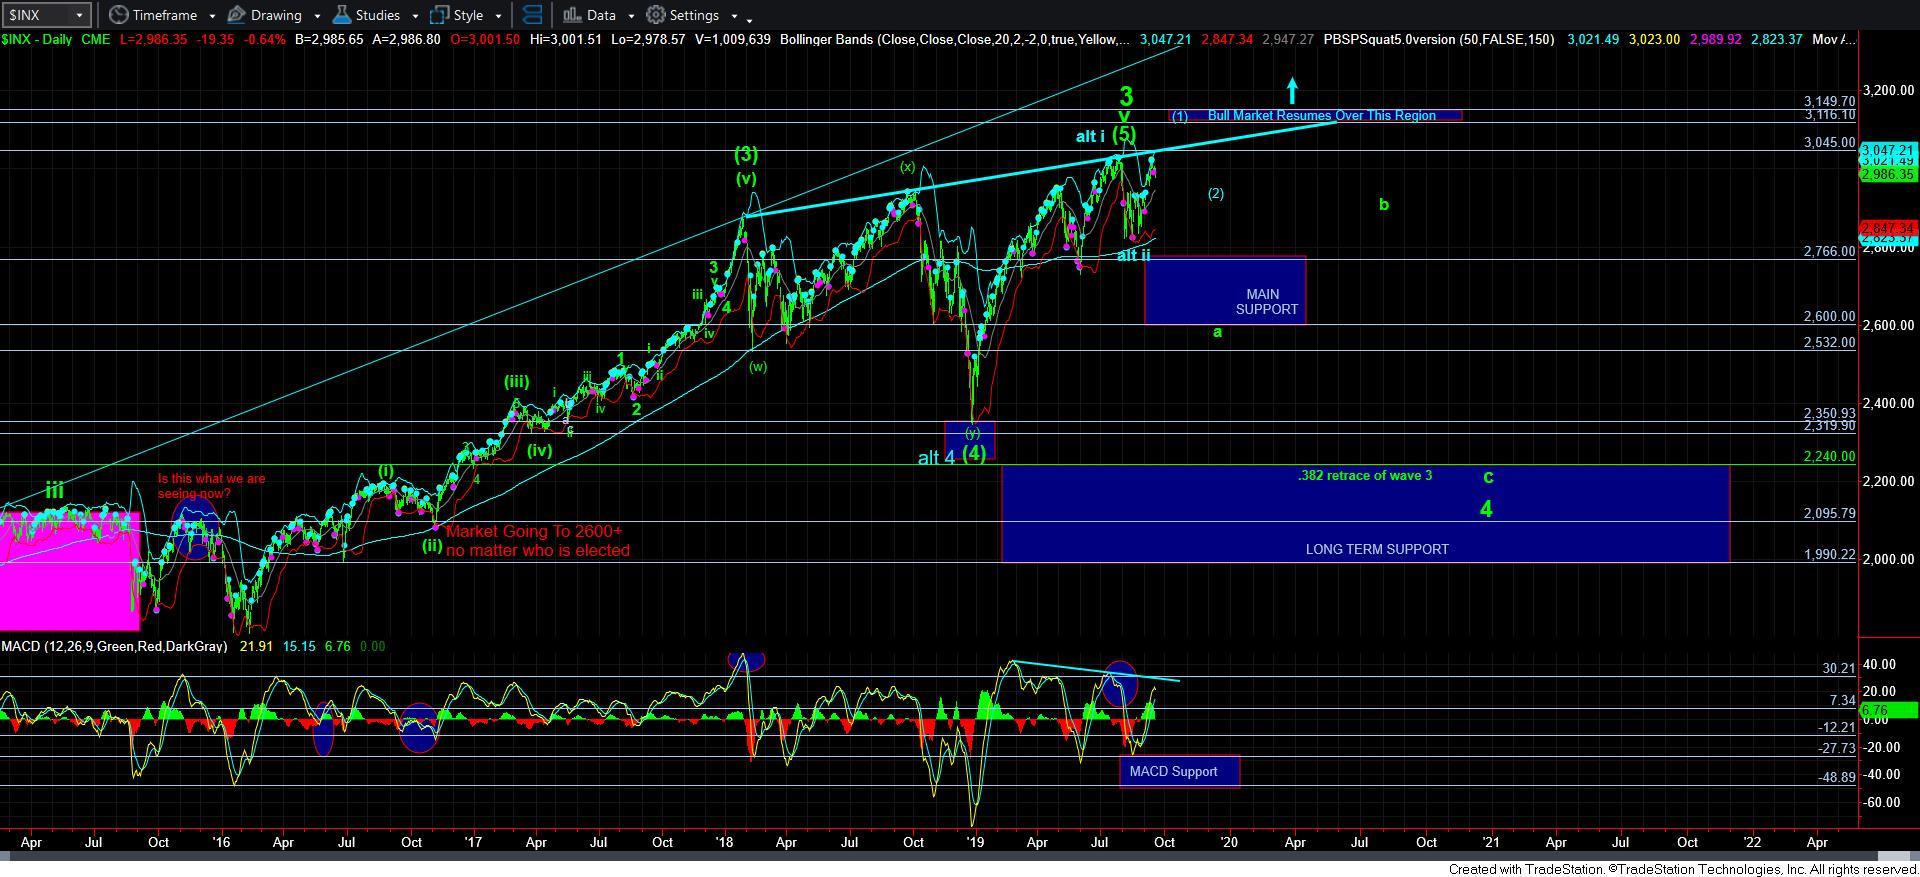
For now, I am viewing this decline as being corrective in nature since I do not have the commensurate potential count in the futures. Should the market prove otherwise with 5 waves down into the 2950SPX region, then I will consider that we have topped, and view corrective rallies off the 2950SPX support region as setting us up for a 3rd wave down in the c-wave. But, until that happens, I think I have to primarily view this decline as corrective, which means a higher high is still very much on the table.
Overall, I still have no change to my larger degree analysis. The only change that I may be able to point towards is that if we do drop down to the 2950SPX region, it will likely mean we have an initial 5 waves down off the highs, and a corrective rally thereafter will likely set us up for a bigger c-wave decline. Yet, until that happens, higher highs still remain on the table before we complete this b-wave. But, risks are certainly rising.